University of Toronto Acceptance Rate: What Official Data Shows
U of T admitted 57,140 of 78,774 applicants to its first-entry programs for 2025-26, a 72.5% admission rate.U of T admitted 72.5% of applicants to its first-entry programs for 2025-26: 57,140 of 78,774, by its own count. That rate combines Arts & Science at St. George, the Mississauga and Scarborough campuses, Engineering, Architecture, Kinesiology and Music, so it isn’t the rate for any one program. Over ten years it ranged from 68.5% (2018-19) to 78.4% (2022-23). U of T also publishes planning ranges by program, which are the better guide for a single program.
The short answer
U of T admitted 57,140 of 78,774 first-entry applicants for 2025-26, a 72.5% admission rate by its own count.
That rate covers Arts & Science at St. George, Mississauga and Scarborough, Engineering, Architecture, Kinesiology and Music, so it is not the rate for one program.
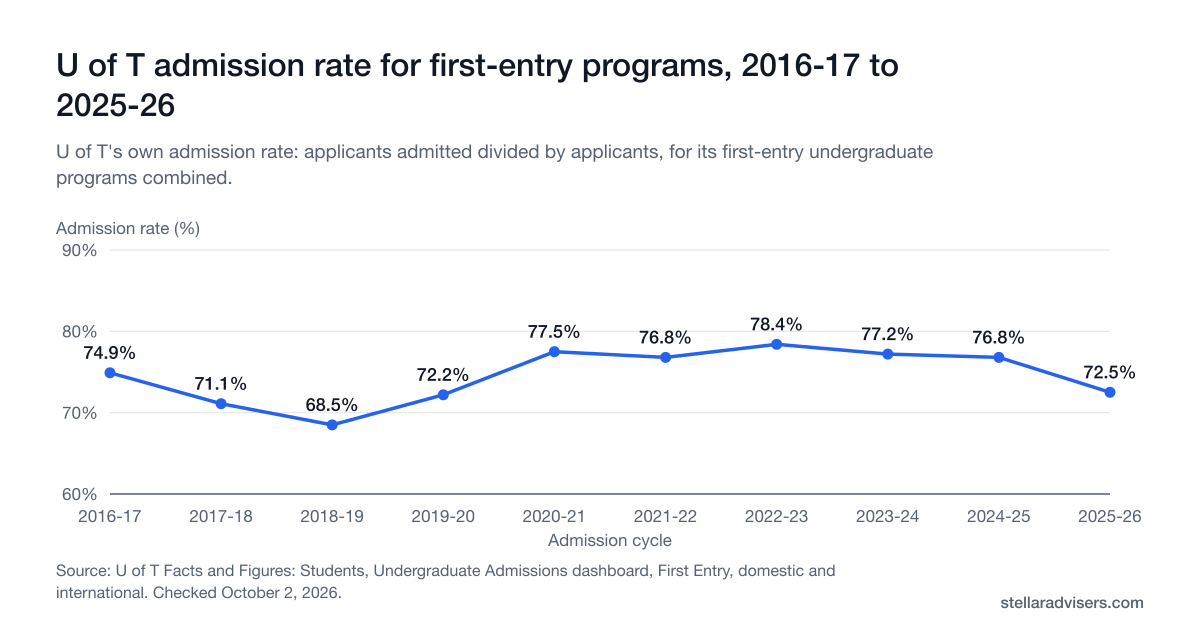
Over ten years the rate ranged from 68.5% in 2018-19 to 78.4% in 2022-23.
OUAC (the Ontario Universities' Application Centre, Ontario's university application site) counts applications, not people, so one student can appear several times.
U of T also publishes planning ranges by program, which are the better guide for a single program.
Reviewed October 8, 2026 · Figures from U of T’s Facts and Figures dashboard and OUAC’s statistics, linked under Official sources
Save this to your free account
Keep these dates where you'll see them. Free account; we email you before each saved date; unsubscribe any time. Your account’s email pause still applies. The calendar file needs no account.
OUAC Group A deadline (Ontario high-school students)January 15, 2027
We did not calculate the 72.5%. U of T’s Institutional Research and Data Governance office publishes it on its Facts and Figures “Undergraduate Admissions” dashboard. We read that dashboard again on October 8, 2026.
Numerator: 57,140 applicants U of T admitted for 2025-26.
Denominator: 78,774 applicants to first-entry programs for 2025-26, domestic and international combined.
Result: 57,140 ÷ 78,774 = 72.5%, the rate U of T itself shows.
What it is not: it is not a rate for one program or one campus, and it leaves out the second-entry programs U of T lists in Dentistry, Law, Medicine, Nursing and Pharmacy. It is also not built from OUAC counts. OUAC counts applications (program choices), so one student can appear several times there.
U of T’s admission rate, 2016-17 to 2025-26
U of T’s Facts and Figures dashboard counts applicants, admitted students and registrations for its first-entry programs each year, and works out the admission rate and the yield rate (the share of admitted students who registered). Domestic and international applicants are combined.
U of T admission rate for first-entry programs, 2016-17 to 2025-26U of T's own admission rate: applicants admitted divided by applicants, for its first-entry undergraduate programs combined.
Source: U of T Facts and Figures: Students, Undergraduate Admissions dashboard, First Entry, domestic and international. Reviewed October 2, 2026. The axis runs from 60% to 90% so the changes are visible. First-entry programs are Arts & Science at St. George, the Mississauga and Scarborough campuses, Engineering, Architecture, Kinesiology and Music, combined; the dashboard doesn't break the rate down by program.
Show the numbers
U of T admission rate for first-entry programs, 2016-17 to 2025-26
University of Toronto first-entry applicants, admitted students, registrations, admission rate and yield rate, 2016-17 to 2025-26, from U of T Facts and Figures.
Cycle
Applicants
Admitted
Registered
Admission rate
Yield rate
2025-26
78,774
57,140
16,546
72.5%
29.0%
2024-25
77,087
59,208
16,385
76.8%
27.7%
2023-24
75,954
58,632
15,738
77.2%
26.8%
2022-23
76,030
59,625
15,313
78.4%
25.7%
2021-22
75,433
57,929
16,104
76.8%
27.8%
2020-21
66,131
51,254
14,474
77.5%
28.2%
2019-20
67,210
48,540
14,319
72.2%
29.5%
2018-19
67,736
46,380
13,836
68.5%
29.8%
2017-18
63,059
44,848
13,895
71.1%
31.0%
2016-17
58,047
43,504
13,533
74.9%
31.1%
Applicants grew from 58,047 in 2016-17 to 78,774 in 2025-26, while registrations rose from 13,533 to 16,546. OUAC, the Ontario Universities’ Application Centre, counts applications rather than people: for Fall 2026 it recorded 68,350 applications to U of T from Ontario high school students and 127,487 in total, including 59,137 from all other applicants.
Sources: U of T Facts and Figures, Students, Undergraduate Admissions dashboard (first entry, re-read October 8, 2026), and OUAC Statistics, September 2026 release.
Older per-program rates
Today’s dashboard combines all first-entry programs. U of T’s own 2002 “Performance Indicators for Governance” report went further and published rates by program group for 1998-99 through 2000-01. Read its labels with care. Its “Offer Rate” is offers divided by applications, the closest match to an admission rate. Its “Acceptance Rate” is registrations divided by applications, which is a different and much lower number.
Category
Measure
1998-99
1999-2000
2000-01
St. George Arts, Science & Commerce
Offer rate (offers ÷ applications)
64.4%
58.5%
55.3%
St. George Arts, Science & Commerce
Registrations ÷ applications
24.4%
20.6%
18.5%
Engineering
Offer rate (offers ÷ applications)
37.9%
44.0%
45.8%
Engineering
Registrations ÷ applications
18.7%
15.6%
17.5%
These figures are more than two decades old and are shown for historical context only. They are not a current acceptance rate. Source: “Performance Indicators for Governance” (2002), U of T Governing Council archive.
What actually determines U of T admission
U of T does not publish one guaranteed admission average. Its 2026-27 Domestic Undergraduate Admissions Bulletin gives prior-year planning ranges instead, which vary by campus and admission category.
U of T's own applicants, admitted students, registrations, admission rate and yield rate for its first-entry programs, 2016-17 to 2025-26. Re-read October 8, 2026; 2025-26 is still the newest year shown.
OUAC's Fall 2026 application counts for U of T from Ontario high school students (68,350) and all other applicants (59,137), September 2026 release, as read by our team on October 2, 2026.
U of T's own 1998 to 2001 offer rates by program group. In this report "Acceptance Rate" means registrations divided by applications, not offers. Historical context only.
U of T Engineering's current published consideration ranges by program.
Frequently asked questions
Direct answers about U of T's admission rate, how many students apply and the planning ranges by program.
U of T admitted 72.5% of applicants to its first-entry programs for 2025-26: 57,140 of 78,774, by its own count on its Facts and Figures dashboard. That rate covers Arts & Science at St. George, the Mississauga and Scarborough campuses, Engineering, Architecture, Kinesiology and Music combined. It is one blended rate, not a rate for any single program, and competitive programs such as Computer Science and Engineering ask for much higher averages.
Yes, within a narrow band. U of T's first-entry admission rate was 74.9% in 2016-17, fell to 68.5% in 2018-19, peaked at 78.4% in 2022-23 and was 72.5% in 2025-26. Applicants rose from 58,047 to 78,774 over the same ten years.
Most applicants are admitted: U of T's combined first-entry admission rate was 72.5% for 2025-26. Difficulty depends on the program. U of T's 2026-27 bulletin lists ranges from the low to mid-80s for St. George Humanities up to the low 90s for St. George Computer Science and the high 80s to mid-90s for Engineering.
There is no single U of T admission average. U of T's 2026-27 Domestic Undergraduate Admissions Bulletin gives prior-year planning ranges only: low to mid-80s for St. George Humanities, mid to high 80s for Rotman Commerce, low 90s for St. George Computer Science, and high 80s through mid-90s for Engineering programs. These are planning references, not guaranteed cut-offs.
U of T counted 78,774 applicants to its first-entry programs for 2025-26, and 16,546 of them registered. OUAC counts applications rather than people: for Fall 2026 it recorded 68,350 applications to U of T from Ontario high school students and 127,487 in total.
U of T's admission-rate dashboard combines all first-entry programs, so it doesn't give a separate rate for Engineering or Computer Science. U of T publishes planning ranges instead: St. George Computer Science lists a low-90s range, and Engineering programs range from the high 80s to the mid-90s, both with a supplemental application on top of the academic range.
Yes. The same program can carry a different planning range at each U of T campus. For example, Computer Science is a low-90s planning range at St. George, and at Scarborough it is a low-90s range for the regular stream but mid-to-high 90s for the co-op stream. Always check the campus-specific admission category, not just the program name.
Planning a U of T application?
A peer adviser who has been through U of T admissions can help you plan your campus and program choices. U of T is the only official source for admission decisions.