Explore guide
Related resources
Browse all resourcesOn this page
McMaster University Acceptance Rate: What Official Data Shows
McMaster's own Fact Book reports a 62% admission rate for Ontario high school applicants in 2024. McMaster’s own Fact Book reports a 62% university-wide “Admission Rate” for new Ontario high school applicants in the 2024 cycle. McMaster does not publish an acceptance rate by program or for every applicant type. Every figure below comes from that Fact Book or from OUAC’s own statistics dashboard, with the exact year attached.
The short answer
- McMaster's own Fact Book reports a 62% admission rate for new Ontario high school applicants in 2024.
- That rate is university-wide, not for one program. It leaves out international, other-province, transfer and mature applicants.
- The 2024 figure comes from 21,072 offers out of 34,082 applicants in the Fact Book 2024|2025.
- OUAC (the Ontario Universities' Application Centre, Ontario's university application site) shows 78,189 applications to McMaster in the 2026 cycle.
- McMaster does not publish an acceptance rate by program or for every applicant type.
Reviewed October 8, 2026 · McMaster revises prior-year figures between Fact Book editions, so always cite the edition year alongside the number
Save this to your free account
Keep these dates where you'll see them. Free account; we email you before each saved date; unsubscribe any time. Your account’s email pause still applies. The calendar file needs no account.
- OUAC Group A deadline (Ontario high-school students)January 15, 2027
Free account. No card needed.
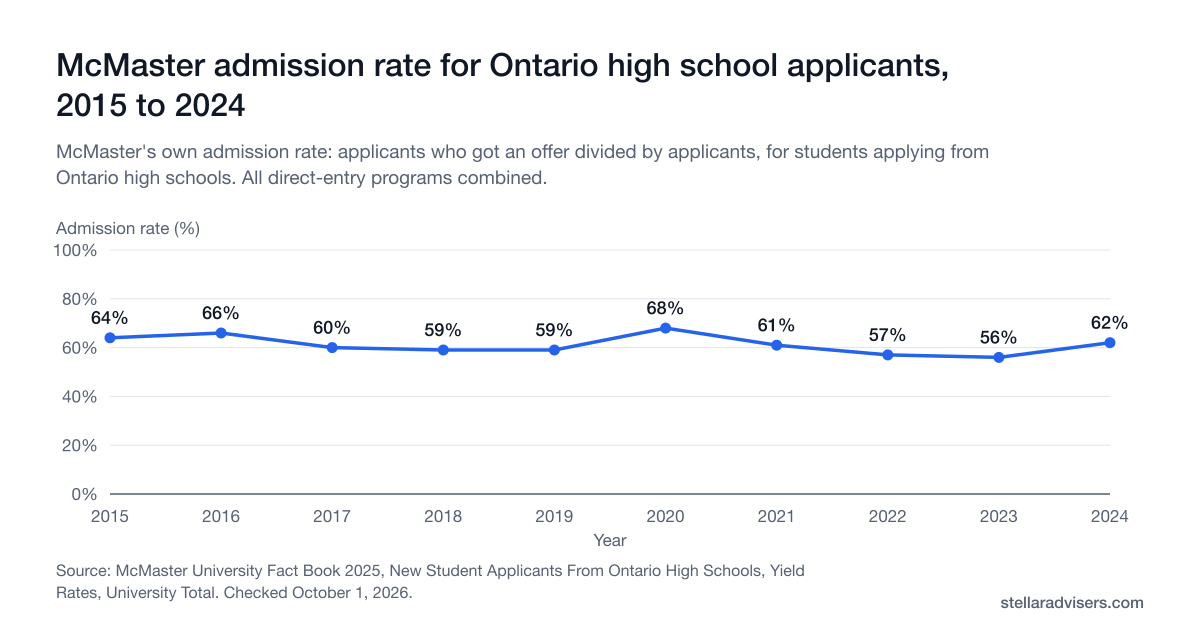
McMaster’s official Admission Rate, Ontario high school applicants
McMaster’s Fact Book defines “Admission” as the number of applicants who received an offer, and reports it as a rate against total applicants: university-wide, for new applicants direct from an Ontario high school. There is no separate row for Health Sciences, Engineering, or any other program.
Source: McMaster University Fact Book 2025, New Student Applicants From Ontario High Schools, Yield Rates, University Total. Reviewed October 1, 2026. McMaster revises past years between Fact Book editions. This chart uses the 2025 edition for every year.
Show the numbers
| Year | Admission rate (%) |
|---|---|
| 2015 | 64% |
| 2016 | 66% |
| 2017 | 60% |
| 2018 | 59% |
| 2019 | 59% |
| 2020 | 68% |
| 2021 | 61% |
| 2022 | 57% |
| 2023 | 56% |
| 2024 | 62% |
| Year | Applicants | Offers | Admission rate | Confirmed | Registered |
|---|---|---|---|---|---|
| 2015 | 27,673 | 17,629 | 64% | 4,948 | 4,604 |
| 2016 | 28,078 | 18,411 | 66% | 5,795 | 5,407 |
| 2017 | 29,044 | 17,553 | 60% | 5,289 | 4,969 |
| 2018 | 30,385 | 17,810 | 59% | 5,478 | 5,182 |
| 2019 | 31,404 | 18,405 | 59% | 5,405 | 5,108 |
| 2020 | 30,404 | 20,792 | 68% | 6,168 | 5,880 |
| 2021 | 33,195 | 20,079 | 61% | 5,761 | 5,451 |
| 2022 | 33,726 | 19,067 | 57% | 5,138 | 5,026 |
| 2023 | 33,063 | 18,641 | 56% | 4,942 | 4,834 |
| 2024 | 34,082 | 21,072 | 62% | 5,420 | 5,322 |
2023’s rate was restated from 57% to 56% between Fact Book editions. McMaster revises prior years, so always cite the edition. Source: McMaster University Fact Book 2024|2025, Office of Institutional Research and Analysis.
McMaster’s Fact Book also reports, university-wide, that the share of undergraduates registering with an admission average of 90% or above rose from 21.9% in 2010 to 61.0% in 2024. This series describes the registered class rather than the admission rate itself.
How we got this number
We did not calculate the 62%. McMaster's Office of Institutional Research and Analysis prints it in the Fact Book 2024|2025, in the table "New Student Applicants From Ontario High Schools, Yield Rates, University Total." We re-read that table on October 8, 2026, and the 2024|2025 edition is still the newest one McMaster has posted.
| Part | 2024 figure | What McMaster counts |
|---|---|---|
| Numerator: offers | 21,072 | Applicants who received an offer (McMaster's note: "# of applicants who received an offer") |
| Denominator: applicants | 34,082 | New applicants from Ontario high schools in the current year |
| Result: admission rate | 62% | 21,072 ÷ 34,082 = 0.618, which McMaster prints as 0.62 |
What it is not: it is not a rate for any one program, and it leaves out international, other-province, transfer and mature applicants. It counts applicants, not OUAC program choices, so it is a true offer rate rather than a floor. Selective programs such as Health Sciences sit far above the blended average in difficulty.
Source: McMaster University Fact Book 2024|2025, Office of Institutional Research and Analysis, re-read October 8, 2026.
Current OUAC application demand
OUAC’s own statistics dashboard publishes current-cycle application counts to McMaster by applicant category: OSSS (Ontario Secondary School Students) and AOA (All Other Applicants). The public dashboard does not publish an offers figure, so these counts show demand rather than an admission rate. Dividing confirmations by applications would combine an admission decision with a student’s later choice to enrol.
| Cycle | OSSS applications | AOA applications | Total applications |
|---|---|---|---|
| 2025 | 58,300 | 16,141 | 74,441 |
| 2026 | 60,196 | 17,993 | 78,189 |
Source: OUAC application statistics dashboard, current as of each cycle’s reporting date.
What actually determines McMaster admission
The Fact Book’s admission rate is a university-wide blend across every direct-entry Ontario high school program. It does not describe any single program’s difficulty. McMaster’s most selective program, the Bachelor of Health Sciences (Honours), publishes its own 90% minimum average for consideration plus a required supplementary application, which is a very different bar than the university-wide blend above.
For Health Sciences prerequisites, the supplementary application, and current deadlines, see our McMaster Health Sciences requirements guide. For McMaster’s other programs, gateways, and Level II selection, see the McMaster programs guide.
Official sources
Every figure on this page links back to the McMaster or OUAC source it came from.
- McMaster University Fact Book 2024|2025
McMaster's own "Admission Rate" table for new Ontario high school applicants, 2015 to 2024, and the 90%-plus admission-average enrolment trend, both university-wide. Re-read October 8, 2026; still the newest edition.
- McMaster University Fact Book 2023|2024
Prior edition, used to cross-check the 2023 admission rate, which McMaster revised between editions.
- OUAC application statistics dashboard
OUAC's own application counts for McMaster, by OSSS and AOA applicant category, for the 2025 and 2026 cycles, as read by our team before this review.
- McMaster Health Sciences (BHSc) Level I admission
McMaster's published minimum secondary school average of 90% for Health Sciences, re-read October 8, 2026.
Frequently asked questions
Direct answers about McMaster's official Fact Book admission rate, current OUAC application demand, and what determines admission by program.
Planning a McMaster application?
A peer adviser who has been through McMaster admissions can help you plan your program choice and supplementary application. McMaster is the only official source for admission decisions.