Explore guide
Related resources
Browse all resourcesOn this page
Western University Acceptance Rate: What Official Data Shows
Western's first-year entrance average was 90.9% in 2023-24, by its own count. Western’s published entrance average for first-year students was 90.9% in 2023-24, its newest figure, from its own facts page. Western publishes no count of offers, so there is no official acceptance rate to quote. Here is what official data does show: Western’s 90.9% entrance average, OUAC’s counts of applications from Ontario high school students (55,208 for Fall 2026), its own historical Common University Data Ontario (CUDO) applicant and registrant tables by program, and current admission-average planning ranges.
The short answer
- Western's first-year entrance average was 90.9% in 2023-24, by its own count.
- Western publishes no count of offers, so there is no official acceptance rate to quote.
- OUAC (the Ontario Universities' Application Centre, Ontario's university application site) counted 55,208 applications from Ontario high school students for Fall 2026.
- 5,608 Ontario high school students confirmed an offer for Fall 2026, which is 10.2% of applications.
- That 10.2% is a floor, not an acceptance rate, because offers are higher than confirmations.
Reviewed October 8, 2026 · The program-level CUDO data below is Fall 2016, the most recent edition publicly hosted by Western · OUAC counts are from the September 2026 release
Save this to your free account
Keep these dates where you'll see them. Free account; we email you before each saved date; unsubscribe any time. Your account’s email pause still applies. The calendar file needs no account.
- Western equal considerationJanuary 15, 2027
Free account. No card needed.
Western’s published entrance average
Western’s own “who we are” facts page states one of Canada’s top entrance averages for first-year students at 90.9%, labelled 2023-24 data. That page does not publish an acceptance-rate figure alongside it, only the entrance average.
How we got these numbers
Western publishes no count of offers, so nobody outside Western can work out its true acceptance rate. The 90.9% entrance average is Western's own figure. The second figure below is our calculation, and it is not an acceptance rate.
| Figure | How it is built | Source and year | What it is not |
|---|---|---|---|
| 90.9% entrance average (Western's figure) | The entering average of Western's first-year students | Western facts page, 2023-24 data | Not an acceptance rate. It describes the grades of students who came. |
| 10.2% (our calculation) | 5,608 Ontario high school students who confirmed ÷ 55,208 applications from Ontario high school students | OUAC Statistics, Fall 2026, September release | Not an acceptance rate. It is a floor that sits well below the true rate. |
Why the 10.2% is a floor: confirmations count students who accepted an offer and chose Western. Many students who get an offer go somewhere else, so offers are much higher than confirmations. Applications count program choices, so one student who lists three Western programs counts three times. Both effects push the ratio below the real share of applicants who get in.
Arithmetic: 5,608 ÷ 55,208 = 0.1016, shown as 10.2%. OUAC counts from the September 2026 release; Western facts page re-read October 8, 2026.
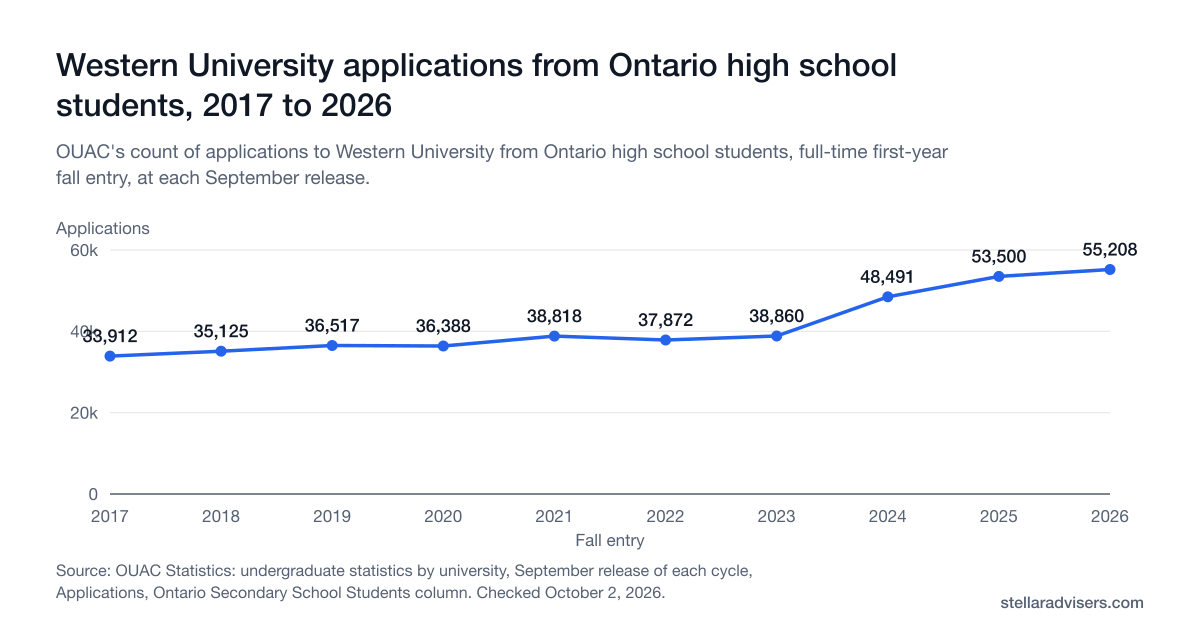
Western applications from Ontario high schools, 2017 to 2026
OUAC, the Ontario Universities' Application Centre, publishes how many applications each university gets from Ontario high school students and how many of those students confirm an offer. For Fall 2026, Western received 55,208 applications from Ontario high school students, and 5,608 students confirmed.
Source: OUAC Statistics: undergraduate statistics by university, September release of each cycle, Applications, Ontario Secondary School Students column. Reviewed October 2, 2026. Applications count the programs students chose, not people, and OUAC publishes no offers, so this shows demand, not an acceptance rate. OUAC lists Western's affiliated colleges (Huron, King's and, until 2023, Brescia) on their own rows; those counts are not included.
Show the numbers
| Fall entry | Applications |
|---|---|
| 2017 | 33,912 |
| 2018 | 35,125 |
| 2019 | 36,517 |
| 2020 | 36,388 |
| 2021 | 38,818 |
| 2022 | 37,872 |
| 2023 | 38,860 |
| 2024 | 48,491 |
| 2025 | 53,500 |
| 2026 | 55,208 |
| Fall entry | Applications | Confirmations |
|---|---|---|
| Fall 2026 | 55,208 | 5,608 |
| Fall 2025 | 53,500 | 5,824 |
| Fall 2024 | 48,491 | 5,411 |
| Fall 2023 | 38,860 | 5,362 |
| Fall 2022 | 37,872 | 5,106 |
| Fall 2021 | 38,818 | 5,219 |
| Fall 2020 | 36,388 | 5,168 |
| Fall 2019 | 36,517 | 4,170 |
| Fall 2018 | 35,125 | 4,231 |
| Fall 2017 | 33,912 | 4,060 |
Applications count the programs students chose, not people, and OUAC doesn't publish offers. So these counts show demand and intake, not an acceptance rate.
Source: OUAC Statistics, undergraduate statistics by university, September release of each cycle, Ontario secondary school students.
Official CUDO applicant and registrant data, by program
Western’s Institutional Planning & Budgeting office hosts a Common University Data Ontario (CUDO) report sourced to OUAC. The most recent edition publicly available at that location covers the Fall 2016 cycle; no newer edition was found there when this guide was reviewed. All figures below are same-cycle.
| Program (Fall 2016) | Applications | Registrants |
|---|---|---|
| Arts, Humanities & Social Science | 10,268 | 1,189 |
| Science | 11,306 | 1,524 |
| Commerce / Management / Business Administration | 7,224 | 773 |
| Engineering & Applied Science | 5,078 | 519 |
| Nursing | 3,178 | 199 |
“Applications” counts every choice submitted to the program; “registrants” counts students who actually registered, not offers of admission. CUDO’s table does not include an offers column, so this is not an acceptance rate. Source: Western CUDO 2017 report, Table B1.
The same Fall 2016 CUDO report also publishes secondary-school averages of incoming first-year students, by program:
What actually determines Western admission today
Western reviews every required course for the selected program plus the applicant’s highest eligible Grade 12 grades. Its current previous-incoming-class typical ranges, by program:
| Program | Prerequisites | Typical range |
|---|---|---|
| Arts & Humanities | ENG4U | Low 80s |
| Social Science | ENG4U | Low to mid 80s |
| Computer Science | ENG4U, MCV4U, MHF4U + one of several sciences | Low to mid 80s |
| Kinesiology | ENG4U and SBI4U | High 80s |
| Medical Sciences | ENG4U, SBI4U, MCV4U, SCH4U | Mid to high 80s |
| Management & Organizational Studies | ENG4U + two of MHF4U/MCV4U/MDM4U | Mid to high 80s |
| Health Sciences | ENG4U, SBI4U + one of MHF4U/MCV4U/MDM4U | High 80s to low 90s |
| Engineering | ENG4U, MHF4U, MCV4U, SCH4U, SPH4U | High 80s to low 90s |
| Nursing | ENG4U, SBI4U, SCH4U + math (70% minimum each) | High 80s to low 90s |
These are averages, not cut-offs or guarantees. Source: Western Ontario high school requirements page. For supplementary applications, Ivey AEO, and full 2027 deadlines, see our Western application deadlines guide or the Western Ivey AEO guide.
Official sources
Every figure on this page links back to the Western source it came from.
- OUAC Statistics: undergraduate statistics by university
OUAC's counts of applications to Western and confirmations from Ontario high school students, full-time first-year fall entry, for the 2017 to 2026 cycles (September release of each cycle).
- Western: who we are, facts and figures
Western's published 2023-24 entrance average of 90.9% for first-year students, still its newest published entrance-average figure when re-read October 8, 2026.
- Western Common University Data Ontario (CUDO) 2017
Western's own Fall 2016 applicant, registrant, and secondary-school-average tables by program, sourced to OUAC and re-read October 8, 2026.
- Western Institutional Planning & Budgeting: Fact Book
No newer CUDO edition was publicly hosted at this location when re-checked October 8, 2026.
- Western Ontario high school requirements and typical ranges
Western's typical average ranges of last year's incoming class, by program, re-read October 8, 2026.
Frequently asked questions
Direct answers about Western's entrance average, official CUDO applicant and registrant data, and current admission-average ranges by program.
Planning a Western application?
A peer adviser who has been through Western admissions can help you plan your program choice and supplementary applications. Western is the only official source for admission decisions.