Explore guide
Related resources
Browse all resourcesOn this page
Carleton University Acceptance Rate: What Official Data Shows
Carleton's Fall 2027 conditional-offer floors run from 70% (Architectural Studies, Arts) to 88% for Mechanical Engineering. Carleton’s conditional-offer floors for Fall 2027 entry, read October 8, 2026, run from 70% to 88%, depending on the program. Carleton publishes no acceptance rate, admission rate or public offer count. Its own admissions dashboards sit behind Carleton’s internal network, and OUAC publishes applications but not offers: 23,778 applications from Ontario high school students for Fall 2026, with 4,601 students confirming. Here is exactly what is and isn’t public, plus Carleton’s current conditional-offer floors by program.
The short answer
- Carleton's Fall 2027 offer conditions set final-average floors from 70% to 88% by program. A minimum grade is not an acceptance rate.
- For Fall 2026, OUAC (the Ontario Universities' Application Centre, Ontario's university application site) counted 23,778 applications from Ontario high school students.
- OUAC counted 4,601 students confirming for Fall 2026.
- Dividing 4,601 by 23,778 gives 19.4%, which is a floor, not an acceptance rate.
- Carleton's own offer counts sit behind its internal network, so the true rate is not public.
Reviewed October 8, 2026 · Carleton’s own counts confirmed unreachable on this date · OUAC counts are from the September 2026 release
Save this to your free account
Keep these dates where you'll see them. Free account; we email you before each saved date; unsubscribe any time. Your account’s email pause still applies. The calendar file needs no account.
- OUAC Group A deadline (Ontario high-school students)January 15, 2027
Free account. No card needed.
How we got these numbers
Carleton keeps its offer counts in internal dashboards, so nobody outside Carleton can work out its true acceptance rate. The 70% to 88% range in the opening answer is Carleton's own: the final averages it asks students to keep to hold a conditional offer for 2027-2028. The second figure below is our calculation, and it is not an acceptance rate.
| Figure | How it is built | Source and year | What it is not |
|---|---|---|---|
| 70% to 88% (Carleton's floors) | The final average needed to keep a conditional offer, by program | Carleton admissions, 2027-2028 academic year, re-read October 8, 2026 | Not an admission cut-off. Carleton says admission is not guaranteed. |
| 19.4% (our calculation) | 4,601 Ontario high school students who confirmed ÷ 23,778 applications from Ontario high school students | OUAC Statistics, Fall 2026, September release | Not an acceptance rate. It is a floor that sits well below the true rate. |
Why the 19.4% is a floor: confirmations count students who accepted an offer and chose Carleton. Many students who get an offer go somewhere else, so offers are much higher than confirmations. Applications count program choices, so one student who lists three Carleton programs counts three times. Both effects push the ratio below the real share of applicants who get in.
Arithmetic: 4,601 ÷ 23,778 = 0.1935, shown as 19.4%. OUAC counts from the September 2026 release; Carleton floors re-read October 8, 2026.
What official counts exist, and what doesn’t
Carleton’s Office of Institutional Research and Planning (OIRP) publishes an “Admissions Data: Undergraduate” index page confirming it holds application, offer, and registration data. Carleton says it is updated “sometimes daily at critical points.” But the page carries no figures itself. It only links to two Power BI dashboards: an admissions summary by degree and a detailed admissions report. Fetched live on October 8, 2026, both requests timed out before a connection was established. The figures therefore remain unavailable from this review environment.
Carleton’s former institutional CUDO page and the province-wide CUDO service were also rechecked. Carleton’s own former Common University Data Ontario (CUDO) index page now returns HTTP 404. It no longer exists on Carleton’s reorganized site. The current province-wide CUDO portal was publicly reachable and links to customized reports, but its landing page does not publish a Carleton offer count used here. Rather than substitute an unofficial number, this guide reports plainly that no public Carleton offer figures were available to calculate a rate as of this review. OUAC’s application counts, below, are public.
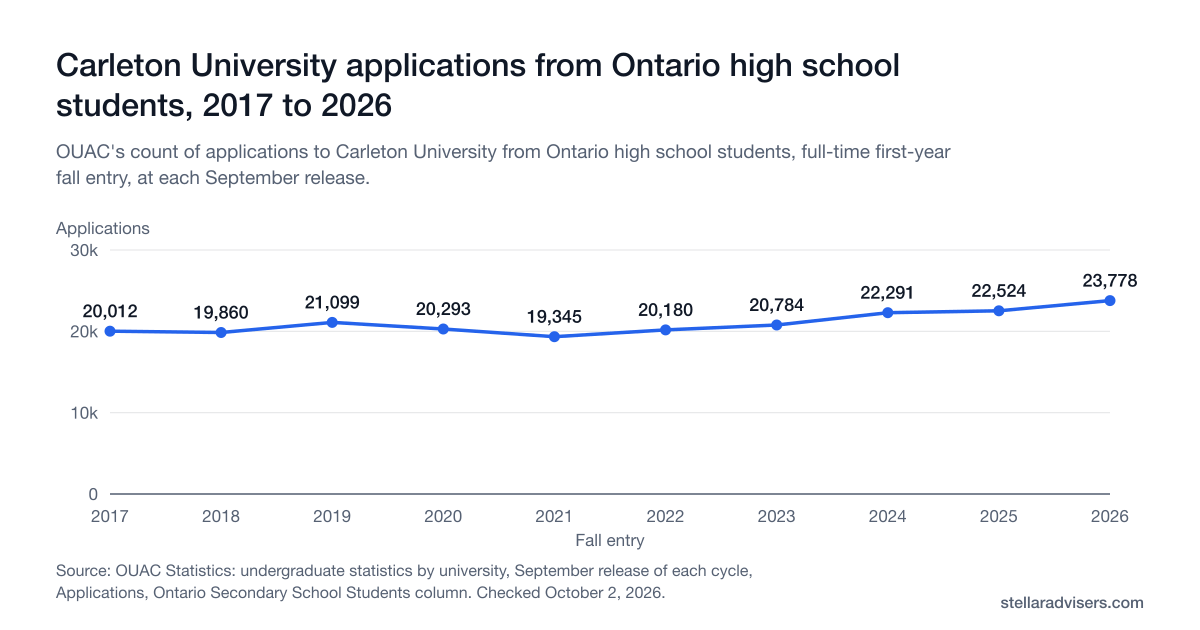
Carleton applications from Ontario high schools, 2017 to 2026
OUAC, the Ontario Universities' Application Centre, publishes how many applications each university gets from Ontario high school students and how many of those students confirm an offer. For Fall 2026, Carleton received 23,778 applications from Ontario high school students, and 4,601 students confirmed.
Source: OUAC Statistics: undergraduate statistics by university, September release of each cycle, Applications, Ontario Secondary School Students column. Reviewed October 2, 2026. Applications count the programs students chose, not people, and OUAC publishes no offers, so this shows demand, not an acceptance rate.
Show the numbers
| Fall entry | Applications |
|---|---|
| 2017 | 20,012 |
| 2018 | 19,860 |
| 2019 | 21,099 |
| 2020 | 20,293 |
| 2021 | 19,345 |
| 2022 | 20,180 |
| 2023 | 20,784 |
| 2024 | 22,291 |
| 2025 | 22,524 |
| 2026 | 23,778 |
| Fall entry | Applications | Confirmations |
|---|---|---|
| Fall 2026 | 23,778 | 4,601 |
| Fall 2025 | 22,524 | 3,850 |
| Fall 2024 | 22,291 | 3,687 |
| Fall 2023 | 20,784 | 3,706 |
| Fall 2022 | 20,180 | 3,793 |
| Fall 2021 | 19,345 | 3,964 |
| Fall 2020 | 20,293 | 3,884 |
| Fall 2019 | 21,099 | 4,314 |
| Fall 2018 | 19,860 | 4,178 |
| Fall 2017 | 20,012 | 4,339 |
Applications count the programs students chose, not people, and OUAC doesn't publish offers. So these counts show demand and intake, not an acceptance rate.
Source: OUAC Statistics, undergraduate statistics by university, September release of each cycle, Ontario secondary school students.
What actually determines Carleton admission
Carleton publishes a conditional-offer floor and prerequisites by program instead of one university-wide figure. We re-read them on October 8, 2026. They are the final averages needed to keep an offer for the 2027-2028 academic year, not guaranteed admission cut-offs. Competitive entry averages can run higher with demand.
| Program | 2027-2028 conditional-offer floor | Prerequisites |
|---|---|---|
| Architectural Studies | 70% | Minimum final grade of 60% in English, Physics and Advanced Functions |
| Arts | 70% | English with a minimum final grade of 60% |
| Science (BSc) | 70% | Combined average of 70% in Advanced Functions and two of Biology, Calculus and Vectors, Chemistry, Physics or Earth and Space Science |
| Commerce | 75% | Advanced Functions at 70%; English at 60%; Calculus and Vectors or Data Management at 60% |
| Journalism | 76% | Minimum final grade of 70% in English |
| Computer Science, Cybersecurity, Data Science | 78% | Average of 76% in Advanced Functions and Calculus and Vectors |
| Nursing (BScN with RN Prescribing) | 78% | Combined average of 75% in English, Advanced Functions, Biology and Chemistry |
| Health Sciences | 80% | Combined average of 75% in Advanced Functions and two of Biology, Chemistry, Physics or Earth and Space Science |
| Public Affairs and Policy Management | 80% | No specific prerequisites required |
| Engineering: Biomedical and Electrical, Civil, Computer Systems, Environmental, Software, Sustainable Electrical Power, Telecommunications | 72% | Combined average of 72% in Advanced Functions, Calculus, Physics and Chemistry |
| Engineering: Architectural Conservation and Sustainability, Engineering Physics | 75% | Combined average of 75% in Advanced Functions, Calculus, Physics and Chemistry |
| Engineering: Systems Security | 78% | Combined average of 78% in Advanced Functions, Calculus, Physics and Chemistry |
| Engineering: Electrical | 80% | Combined average of 80% in Advanced Functions, Calculus, Physics and Chemistry |
| Engineering: Mechatronics, Sustainable Energy | 82% | Combined average of 82% in Advanced Functions, Calculus, Physics and Chemistry |
| Engineering: Biomedical and Mechanical | 84% | Combined average of 84% in Advanced Functions, Calculus, Physics and Chemistry |
| Engineering: Aerospace | 86% | Combined average of 86% in Advanced Functions, Calculus, Physics and Chemistry |
| Engineering: Mechanical | 88% | Combined average of 88% in Advanced Functions, Calculus, Physics and Chemistry |
Source: Carleton University, “Maintaining your conditional offer of admission for the 2027-2028 academic year,” re-read October 8, 2026. Carleton says admission is not guaranteed and all requirements are subject to change, so confirm the floor on the live page before applying.
| Admission average | Renewable entrance scholarship |
|---|---|
| 95%–100% | $3,000/year, up to $12,000 |
| 90%–94.9% | $2,000/year, up to $8,000 |
| 85%–89.9% | $1,000/year, up to $4,000 |
For deadlines, the Prestige Scholarships, co-op, tuition, and residence, see the complete Carleton University admissions guide.
Official sources
Every figure and finding on this page links back to the Carleton or provincial source it came from.
- OUAC Statistics: undergraduate statistics by university
OUAC's counts of applications to Carleton and confirmations from Ontario high school students, full-time first-year fall entry, for the 2017 to 2026 cycles (September release of each cycle).
- Admissions Data: Undergraduate (OIRP)
Carleton's Office of Institutional Research and Planning says: "There are four admission statistics that we follow throughout the undergraduate admission cycle: applicants, approvals (offers), confirmations, and registrations." The page itself carries no figures; it only links to dashboards. Re-read October 8, 2026.
- Undergraduate Admissions Summary by Degree (Fall): Power BI dashboard
The dashboard OIRP names as the source for admissions summary figures. On October 8, 2026 the request again timed out before connecting, so the figures are not publicly reachable.
- Common University Data Ontario: Carleton's former index
Carleton previously mirrored its CUDO applicant, registrant, and entering-average tables at this address. It still returned HTTP 404 on October 8, 2026.
- Common University Data Ontario: provincial portal
Ontario Universities' public CUDO landing page, reachable October 8, 2026. It describes university data such as enrolment and entering averages but does not publish a Carleton offer count.
- Maintaining your conditional offer of admission for 2027-2028
Carleton's conditional-offer floors and prerequisites by program for the 2027-2028 academic year (Fall 2027 entry), from 70% for Architectural Studies and Arts to 88% for Mechanical Engineering. Re-read October 8, 2026.
- Ontario high-school admission framework
Carleton's Ontario high school requirements (OSSD with six 4U or 4M courses, no prerequisite below 60%) and its statement that "Admission is not guaranteed and all requirements are subject to change." Re-read October 8, 2026.
Frequently asked questions
Direct answers about how many students apply to Carleton, why its offer data isn't public, and the admission floors and scholarship thresholds it does publish.
Planning a Carleton application?
A peer adviser who has been through Carleton admissions can help you plan your program choice. Carleton is the only official source for admission decisions.