Explore guide
Related resources
Browse all resourcesOn this page
Toronto Metropolitan University Acceptance Rate: What Official Data Shows
TMU's own data: 7.39 applications for every first-year registrant in Fall 2023 and an 86.09% entering average in Fall 2025. TMU’s own data shows 7.39 applications (counting every program choice) for each first-year registrant in Fall 2023, and an 86.09% mean entering average in Fall 2025. Both figures come from TMU’s University Planning Office, in “Senate Progress Indicator 1.” It publishes an applications-to-registrants ratio, entering-average data, and the share of entrants above 85%, by year, faculty, and program, back to Fall 2014. Every number below is TMU’s own, with the exact page and date attached; none of it can be turned into an offers-to-applicants percentage, because TMU does not publish an offers-made or admitted-applicant count.
The short answer
- In Fall 2023, TMU counted 7.39 applications for each first-year registrant.
- That is a demand ratio, not an acceptance rate. TMU does not publish one.
- For Fall 2025, the mean entering average was 86.09% for Ontario secondary-school entrants.
- The applications-to-registrants ratio has no Fall 2024 or Fall 2025 value yet.
- For Ontario secondary-school applicants, the floor is the OSSD (your Ontario high school diploma), six Grade 12 U/M courses and a 70% average.
Reviewed October 8, 2026 · Toronto Metropolitan University was formerly Ryerson University, and some TMU data files and older links still carry the Ryerson name
Save this to your free account
Keep these dates where you'll see them. Free account; we email you before each saved date; unsubscribe any time. Your account’s email pause still applies. The calendar file needs no account.
- TMU guaranteed considerationFebruary 1, 2027
Free account. No card needed.
How we got these numbers
We did not calculate any figure in the opening answer. TMU's University Planning Office works them out itself in Senate Progress Indicator 1, "Applications and Entering Averages," updated March 2026. We re-read that workbook on October 8, 2026, and it is still the newest edition TMU links to.
| Figure | How TMU builds it | Year | What it is not |
|---|---|---|---|
| 7.39 applications per registrant | Applications (all program choices) ÷ first-year registrants on November 1 | Fall 2023, the newest year TMU shows for this ratio | Not an acceptance rate. It has no offers in it. |
| 86.09% mean entering average | Average of newly admitted Ontario high school students in first year on November 1 | Fall 2025 | Not a cut-off. It describes students who came. |
| 61.49% with 85% or higher | Share of those entrants whose admission average was 85% or higher | Fall 2025 | Not a share of applicants admitted. |
Why we do not flip 7.39 into a percentage: one divided by 7.39 is registrants per application, not offers per applicant. TMU says one student can send more than three applications, and many students who get an offer register somewhere else. That number would sit far below TMU's real offer rate, so we do not print it.
Source: TMU Senate Progress Indicator 1 workbook (March 2026), sheets 1a, 1b and 1c, re-read October 8, 2026.
Registrants and entering averages, Fall 2021 to 2025
TMU’s Senate Progress Indicator 1 reports, university-wide and for full-time first-entry programs only, the number of Year-1 New-to-TMU registrants, the mean entering average of newly admitted Ontario secondary-school students, and the share of those entrants with an admission average of 85% or higher.
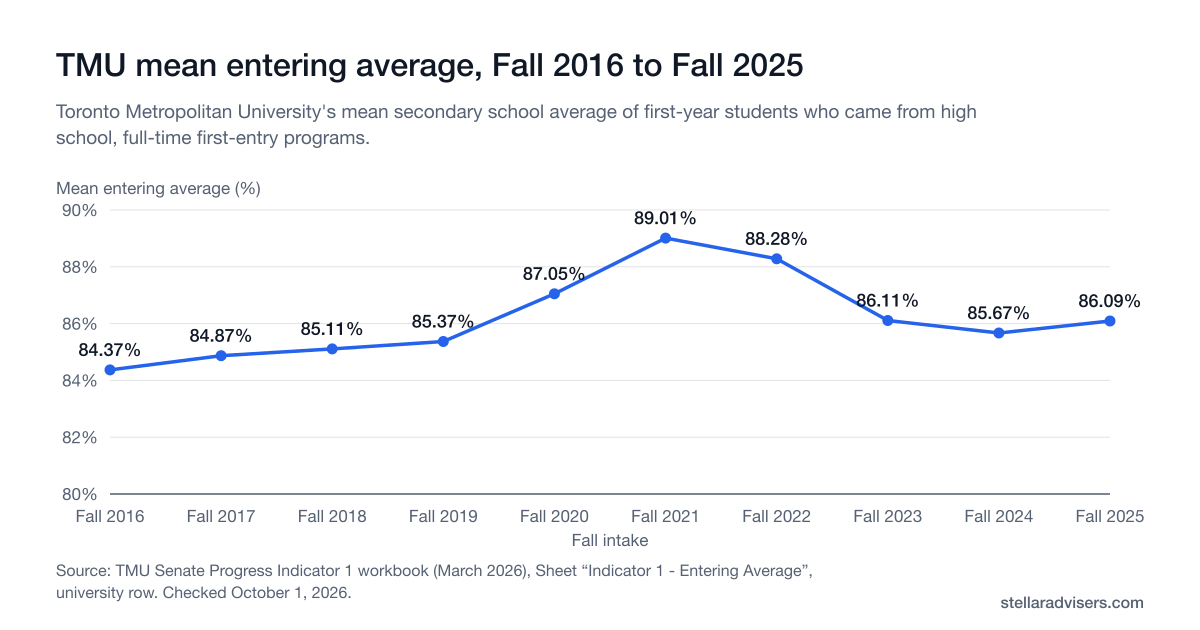
Source: TMU Senate Progress Indicator 1 workbook (March 2026), Sheet “Indicator 1 - Entering Average”, university row. Reviewed October 1, 2026. The axis starts at 80% so the changes are visible. These are averages of students who enrolled, not admission cut-offs.
Show the numbers
| Fall intake | Mean entering average (%) |
|---|---|
| Fall 2016 | 84.37% |
| Fall 2017 | 84.87% |
| Fall 2018 | 85.11% |
| Fall 2019 | 85.37% |
| Fall 2020 | 87.05% |
| Fall 2021 | 89.01% |
| Fall 2022 | 88.28% |
| Fall 2023 | 86.11% |
| Fall 2024 | 85.67% |
| Fall 2025 | 86.09% |
| Term | Year-1 registrants | Mean entering average | Share with 85%+ average |
|---|---|---|---|
| Fall 2021 | 8,548 | 89.01% | 79.95% |
| Fall 2022 | 8,195 | 88.28% | 74.23% |
| Fall 2023 | 8,668 | 86.11% | 60.71% |
| Fall 2024 | 8,849 | 85.67% | 56.97% |
| Fall 2025 | 8,608 | 86.09% | 61.49% |
Source: TMU Senate Progress Indicator 1 workbook, updated March 2026, re-read October 8, 2026. Entering averages and the 85%+ share cover students admitted directly from an Ontario secondary school and registered in first year on November 1 of each cycle.
Applications-to-registrants ratio
TMU’s own Indicator 1a is the “ratio of applications (all choices) to registrants.” TMU’s footnotes say applicants can submit more than three applications if they choose, and every application is counted, not just one per applicant. They also say data limitations do not allow separating qualified from unqualified applications. This is a demand ratio, not an acceptance rate, and TMU gives no way to convert it into one. TMU has not yet published a Fall 2024 or Fall 2025 value for this specific sub-indicator.
| Term | Applications (all choices) per registrant |
|---|---|
| Fall 2019 | 8.41 |
| Fall 2020 | 7.83 |
| Fall 2021 | 7.59 |
| Fall 2022 | 8.11 |
| Fall 2023 | 7.39 |
Source: TMU Senate Progress Indicator 1 workbook (Indicator 1a), re-read October 8, 2026, based on OUAC data files per TMU’s own notes.
Demand and averages by program
TMU’s Indicator 1 workbook breaks both figures out by program. The entering-average column is TMU’s own computed mean for the actual entering class, so it can run higher than the historical planning range published on an individual program page (see the table further down), which quotes a prior-cycle floor rather than a mean.
| Program | Fall 2023 apps-to-regs ratio | Fall 2025 mean entering average |
|---|---|---|
| Criminology | 13.42 | 85.73% |
| Computer Science (FT) | 11.19 | 87.47% |
| Architectural Science | 11.03 | 90.64% |
| Collaborative Nursing (4 Yr) | 9.38 | 92.06% |
| Mechanical Engineering | 6.54 | 90.10% |
| Business Management (FT) | 5.50 | 83.81% |
Source: TMU Senate Progress Indicator 1 workbook, re-read October 8, 2026. Neither column is an acceptance rate.
What TMU doesn’t publish
TMU’s Enrolment and Faculty Counts page and its Board Performance Indicators framework (31 indicators across Strategic Direction, Financial Capacity, Effective Management, and University Profile) were both checked live on October 8, 2026 and neither publishes an application, offer, or admitted-student count. TMU’s School of Medicine states its inaugural MD cohort was 94 students in September 2025 and its second cohort is 94 students in September 2026, but does not publish an MD application total or acceptance rate, unlike some other Canadian medical schools.
Two other sources also came up empty for TMU, checked the same day. The province-wide Common University Data Ontario (CUDO) landing page loads, but it shows no TMU offer count, and CUDO’s admission table counts applicants and registrants, not offers. OUAC’s own Toronto Metropolitan University guide page blocks automated requests and lists programs, not offers. Rather than substitute an unofficial number, this guide reports plainly that no official applicant, offer, or admitted-student count is publicly available for TMU as of this review.
What actually determines TMU admission
TMU’s eligibility floor for Ontario secondary-school applicants is the OSSD, six Grade 12 U/M courses, and at least a 70% overall average, plus every program prerequisite. TMU states meeting the minimum doesn’t guarantee admission. Individual program pages separately publish a planning range from a prior cycle, not a guaranteed cut-off for the next one.
| Program | Current published range | Prerequisites | Selection |
|---|---|---|---|
| Business Management | High 70s | Grade 12 U English and one of Calculus and Vectors, Advanced Functions, or Data Management; Calculus is preferred. | Grades-Only |
| Computer Science | Low 80s | Grade 12 U English, Advanced Functions, Calculus and Vectors or Data Management, and one of Physics, Chemistry, or Biology. | Grades-Only |
| Accounting & Finance | Mid 80s | Grade 12 U English, Advanced Functions, and Calculus and Vectors. | Grades-Only |
| Engineering | TMU encourages 80%+ | Grade 12 U English, Advanced Functions, Calculus and Vectors, Physics, and Chemistry. | Grades-Only |
| Collaborative Nursing — TMU site | 90%+ | Grade 12 U English, Chemistry, Biology, and one eligible Grade 11 U/M or Grade 12 U mathematics course. | Grades-Only |
| Architectural Science | 70% eligibility; TMU encourages 80%+ | Grade 12 U English, Physics, and either Calculus and Vectors or Advanced Functions. | Grades-Plus |
Source: TMU program pages, current published ranges and prerequisites, re-verified live August 25, 2026. For deadlines, ChooseTMU, Grades-Plus formats, and the full requirements by program, see the complete TMU admissions guide.
Official sources
Every figure on this page links back to the TMU or provincial source it came from.
- Senate Progress Indicator 1 workbook (March 2026)
TMU's own "Applications and Entering Averages" workbook: the university-wide and by-program applications-to-registrants ratio (Indicator 1a), mean entering average (1b), share of entrants with an 85%+ average (1c), and Year-1 New-to-TMU registrant counts. Re-read October 8, 2026.
- University Planning Office: Senate Progress Indicators
TMU's index page linking to the Indicator 1 workbook above. On October 8, 2026 the March 2026 workbook was still the newest linked.
- University Planning Office: Enrolment and Faculty Counts
TMU's public enrolment datasets cover headcounts by program, gender, age, and geographic source. They include no application, offer, or admitted-student counts. Re-checked October 8, 2026.
- University Planning Office: Board Performance Indicators
TMU's 31 Board Performance Indicators framework; its landing page lists no application, offer, or acceptance-rate metric among its Strategic Direction, Financial Capacity, Effective Management, or University Profile categories. Re-checked October 8, 2026.
- TMU undergraduate application dates
TMU's Fall 2027 admission dates, including February 1 as the guaranteed consideration date for applications to all programs. Re-read October 8, 2026.
- TMU Ontario secondary school requirements
TMU's eligibility floor (OSSD, six Grade 12 U or M courses, minimum 70% overall average) and its statement that "Possession of the minimum requirements doesn't guarantee admission." Re-read October 8, 2026.
- TMU School of Medicine: MD admissions
TMU's own inaugural (94 students, September 2025) and second (94 students, September 2026) MD cohort sizes; the page does not publish MD application totals or an acceptance rate. Re-read October 8, 2026.
- Common University Data Ontario (CUDO) portal
The province-wide CUDO landing page, which loaded on October 8, 2026. It describes the data and links to reports but shows no TMU offer count. CUDO's admission table counts applicants and registrants, not offers. No figure on this page comes from CUDO.
- OUAC: Toronto Metropolitan University guide
OUAC's own TMU program guide. It blocks automated requests (HTTP 403, checked October 8, 2026), and OUAC's guides list programs, not offers. No figure on this page comes from OUAC's guide.
Frequently asked questions
Direct answers about TMU's own applications-to-registrants ratio, entering averages, and what TMU doesn't publish.
Planning a TMU application?
A peer adviser who has been through TMU admissions can help you plan your program choice and application. TMU is the only official source for admission decisions.