Explore guide
Related resources
Browse all resourcesOn this page
York University Acceptance Rate: What Official Data Shows
York's Fall 2027 requirements list averages from the mid-70s for Data Science to the low 90s for Schulich BBA. York’s admission requirements for Fall 2027 entry, read October 8, 2026, list averages from the mid-70s for programs such as Data Science to the low 90s for Schulich BBA. York publishes no acceptance rate, admission rate or offer count. Its own admissions dashboard is for York accounts only, but OUAC publishes how many Ontario high school students apply to York: 55,285 applications for Fall 2026, with 8,785 students confirming. Here is what’s public, plus York’s current program-by-program admission ranges and offer conditions.
The short answer
- York's published admission ranges run from the mid-70s for Data Science to the low 90s for the Schulich BBA.
- The Schulich BBA asks for an 88% final average, plus a leadership profile, video interview and timed writing exercise.
- Computer Science sits in the low 80s, with a 78% final-average offer condition.
- Direct-Entry Nursing sits in the high 80s and asks for an 86% final average.
- OUAC, the Ontario Universities' Application Centre, counted 55,285 applications to York from Ontario high school students for Fall 2026. York doesn't publish offer counts or an acceptance rate.
Reviewed October 8, 2026 · OUAC counts are from the September 2026 release
Save this to your free account
Keep these dates where you'll see them. Free account; we email you before each saved date; unsubscribe any time. Your account’s email pause still applies. The calendar file needs no account.
- York, Ontario high-school applicantsJanuary 15, 2027
Free account. No card needed.
How we got these numbers
York publishes no count of offers, so nobody outside York can work out its true acceptance rate. The ranges in the opening answer are York's own words from its admission requirements for Fall 2027 entry, re-read October 8, 2026. The second figure below is our calculation, and it is not an acceptance rate.
| Figure | How it is built | Source and year | What it is not |
|---|---|---|---|
| Mid-70s to low 90s (York's ranges) | York: applicants with averages in the range "or higher may be considered for admission" | York admission requirements, Fall 2027 entry | Not a cut-off and not a guarantee. Not an acceptance rate. |
| 15.9% (our calculation) | 8,785 Ontario high school students who confirmed ÷ 55,285 applications from Ontario high school students | OUAC Statistics, Fall 2026, September release | Not an acceptance rate. It is a floor that sits well below the true rate. |
Why the 15.9% is a floor: confirmations count students who accepted an offer and chose York. Many students who get an offer go somewhere else, so offers are much higher than confirmations. Applications count program choices, so one student who lists three York programs counts three times. Both effects push the ratio below the real share of applicants who get in.
Arithmetic: 8,785 ÷ 55,285 = 0.1589, shown as 15.9%. OUAC counts from the September 2026 release; York requirements re-read October 8, 2026.
What official counts exist, and what doesn’t
York’s Office of Institutional Planning and Analysis (OIPA) lists an “Undergraduate Admissions Dashboard” on its Data Hub, described as covering “York’s current and historical enrolment funnel for undergraduate students.” Re-checked on October 8, 2026, that link still leads to a Power BI app for York accounts, not public data. OIPA’s public Quick-Facts index lists other dashboards, covering enrolment headcounts, degrees granted, faculty and staff counts, and graduation and employment rates. None of them covers applications, offers, or an admission rate. York’s older Factbook is retired outright: its own page states “Factbook is no longer being updated.”
York’s monthly Pre-Term Registration reports count enrolled students against the prior year and its enrolment targets, not applications or offers. The public application figures come from OUAC instead, below.
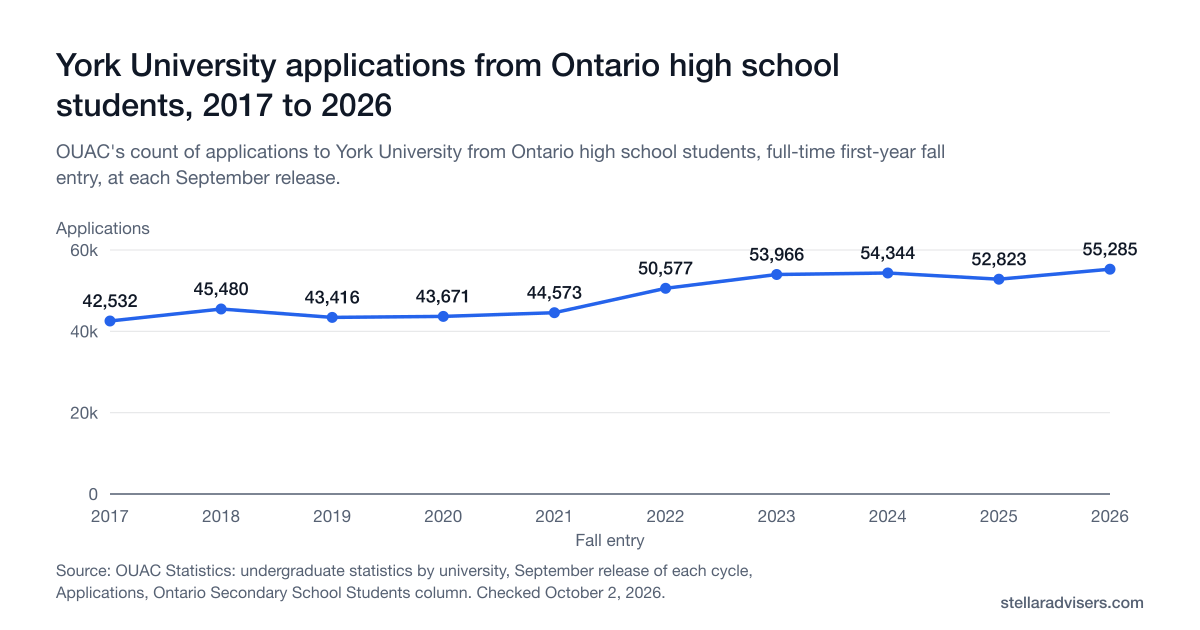
York applications from Ontario high schools, 2017 to 2026
OUAC, the Ontario Universities' Application Centre, publishes how many applications each university gets from Ontario high school students and how many of those students confirm an offer. For Fall 2026, York received 55,285 applications from Ontario high school students, and 8,785 students confirmed.
Source: OUAC Statistics: undergraduate statistics by university, September release of each cycle, Applications, Ontario Secondary School Students column. Reviewed October 2, 2026. Applications count the programs students chose, not people, and OUAC publishes no offers, so this shows demand, not an acceptance rate.
Show the numbers
| Fall entry | Applications |
|---|---|
| 2017 | 42,532 |
| 2018 | 45,480 |
| 2019 | 43,416 |
| 2020 | 43,671 |
| 2021 | 44,573 |
| 2022 | 50,577 |
| 2023 | 53,966 |
| 2024 | 54,344 |
| 2025 | 52,823 |
| 2026 | 55,285 |
| Fall entry | Applications | Confirmations |
|---|---|---|
| Fall 2026 | 55,285 | 8,785 |
| Fall 2025 | 52,823 | 7,528 |
| Fall 2024 | 54,344 | 6,653 |
| Fall 2023 | 53,966 | 7,441 |
| Fall 2022 | 50,577 | 7,526 |
| Fall 2021 | 44,573 | 7,188 |
| Fall 2020 | 43,671 | 6,343 |
| Fall 2019 | 43,416 | 6,160 |
| Fall 2018 | 45,480 | 6,854 |
| Fall 2017 | 42,532 | 7,296 |
Applications count the programs students chose, not people, and OUAC doesn't publish offers. So these counts show demand and intake, not an acceptance rate.
Source: OUAC Statistics, undergraduate statistics by university, September release of each cycle, Ontario secondary school students.
Official program-by-program admission ranges
York’s undergraduate admission-requirements selector publishes a planning range and a final-average offer condition for each program, for Fall 2027 entry. We re-read it on October 8, 2026. “Current range” is York’s published planning guidance; “offer condition” is the final average currently needed to keep an offer. Neither is a guaranteed Fall 2027 cut-off.
| Program | Current range | Current offer condition | Ontario prerequisites | Additional review |
|---|---|---|---|---|
| Schulich BBA | Low 90s | 88% final average | ENG4U and MHF4U at 70% or higher; MCV4U or MDM4U; three additional 4U/M courses, with no more than two 4M courses | Leadership profile, video interview, and timed writing exercise |
| First-Year Engineering Core | Mid-80s | 78% final average | ENG4U, MHF4U, MCV4U, SCH4U, SPH4U, and one additional 4U/M | Optional BOOST co-application for the Engineering Program Guarantee |
| Computer Science BSc | Low 80s | 78% final average; 75% math average and no math prerequisite below 65% | ENG4U, MHF4U, one of MCV4U or MDM4U, one of SCH4U or SPH4U, and two additional 4U/M courses | Optional later-entry Lassonde co-op |
| Direct-Entry Nursing BScN | High 80s | 86% final average | ENG4U, one 4U math, SBI4U, one of SCH4U or SPH4U, and two additional 4U/M courses; no prerequisite below 70% | Current applicant-status restrictions must be checked before applying |
| Data Science BSc | Mid-70s | 70% final average | ENG4U, MHF4U at 75% or higher, MCV4U, one of SBI4U/SCH4U/SPH4U, and two additional 4U/M courses | Optional Faculty of Science co-op |
| Design BDes | Low 80s | 80% final average | ENG4U and five additional 4U/M courses | Supplementary evaluation required |
| Kinesiology & Health Science BSc | Mid-70s | 74% final average | ENG4U, one 4U math, one of SCH4U or SPH4U, and three additional 4U/M courses | Optional Faculty of Health co-op |
| Actuarial Science BA | Mid-70s | 70% final average | ENG4U, MHF4U, and four additional 4U/M courses; MCV4U is recommended | Optional Faculty of Science co-op |
Source: York University undergraduate admission-requirements selector. York states that meeting a published range does not guarantee admission, and that these are current planning figures rather than confirmed Fall 2027 cut-offs.
What actually determines York admission
The ranges above are current planning evidence, not guaranteed cut-offs, and they span 18 percentage points across York’s programs. Data Science, Kinesiology and Health Science, and Actuarial Science currently sit at a 70% to 74% final-average offer condition, while Direct-Entry Nursing needs 86% and Schulich BBA needs 88% plus a mandatory leadership profile, video interview, and timed writing exercise. Computer Science reviews prerequisite math within the average rather than on a pass/fail basis, requiring a 75% math average with no math prerequisite below 65%, on top of its 78% final-average condition.
For deadlines, scholarships, co-op, residence, and the full program-by-program breakdown, see the complete York University admissions guide.
Official sources
Every figure and finding on this page links back to the York or provincial source it came from.
- OUAC Statistics: undergraduate statistics by university
OUAC's counts of applications to York and confirmations from Ontario high school students, full-time first-year fall entry, for the 2017 to 2026 cycles (September release of each cycle).
- Undergraduate admission-requirements selector
York's own program-by-program admission ranges, final-average offer conditions, and prerequisites for Fall 2027 entry, reused in the table below. Re-read October 8, 2026: Schulich BBA (YBA) low 90s with an 88% final average, Computer Science low 80s with 78%, Engineering mid-80s with 78%, Direct-Entry Nursing high-80s with 86%.
- Office of Institutional Planning and Analysis (OIPA) home
York's institutional-research office page, re-checked October 8, 2026. It links to Quick-Facts, the Data Hub, and enrolment reporting. No page there labels a figure an acceptance rate or admission rate.
- OIPA Data Hub
Lists York's “Undergraduate Admissions Dashboard,” described as covering “York's current and historical enrolment funnel for undergraduate students.” The link is a Power BI app for York accounts, not public data. Re-checked October 8, 2026.
- OIPA Quick-Facts index
York's public dashboard index, covering enrolment headcounts, degrees granted, faculty and staff counts, research awards, and graduation and employment rates. None covers applications, offers, or an acceptance rate. Re-checked October 8, 2026.
- OIPA: Common University Data Ontario (CUDO)
York's own CUDO page hosts no figures. It states "CUDO data for each Ontario University can be found at the Common University Data Ontario Website" and links out to the provincial portal. Re-checked October 8, 2026.
- Common University Data Ontario (CUDO) portal
The province-wide CUDO landing page (cudo.ouac.on.ca now redirects here). It loaded normally on October 8, 2026, but it describes the data and links to reports; it does not show York's admission counts or any offer count.
- CUDO Customized Reports tool (Council of Ontario Universities)
The CUDO portal's "View Customized Reports" tool. When we checked it on August 25, 2026, it listed a "B. Admission" category with York selectable, but its year filter stopped at Calendar Year 2022 and its results could not be retrieved automatically. CUDO's admission table counts applicants and registrants, not offers.
- OIPA Pre-Term Registration reports
York's monthly enrolment report index, re-checked October 8, 2026. The Fall 2025 edition (compiled September 18, 2025) reports undergraduate and graduate FFTE/FTE headcounts and percentage change versus the prior year. These are enrolled headcounts, not application or offer counts.
- OIPA Factbook (retired)
York's former Factbook still says "Factbook is no longer being updated," so it is not a current source for admissions figures. Re-checked October 8, 2026.
- About York
York's own total enrolled scale (53,100+ students in 200+ programs) for context. It is an enrolled headcount, not an admissions-funnel figure.
Frequently asked questions
Direct answers about how many students apply to York, why its offer data isn't public, and the admission ranges and offer conditions it does publish.
Planning a York application?
A peer adviser who has been through York admissions can help you plan your program choice and application. York is the only official source for admission decisions.