Explore guide
Related resources
Browse all resourcesOn this page
University of Windsor Acceptance Rate: What Official Data Shows
The University of Windsor's Fall 2025 first-year class from Ontario high schools averaged 84.5%. Windsor's Office of Institutional Analysis publishes that average every year, by faculty, along with Common University Data Ontario (CUDO) counts of applicants and registrants. It doesn't publish offers, so no acceptance rate can be worked out. Here's what the figures show.
The short answer
- Windsor's Fall 2025 first-year class from Ontario high schools averaged 84.5%.
- The school doesn't publish offers, so no acceptance rate can be worked out.
- CUDO (Common University Data Ontario, the data Ontario universities publish) counts applicants and registrants, not offers.
- In Fall 2022, Social Sciences had 409 first-choice applicants and 143 first-choice registrants.
- Your Grade 12 average in required courses decides most offers.
Reviewed October 1, 2026 · Every figure below comes from a University of Windsor report, linked at the end
Save this to your free account
Keep these dates where you'll see them. The calendar file needs no account.
- OUAC Group A deadline (Ontario high-school students)January 15, 2027
Free account. No card needed.
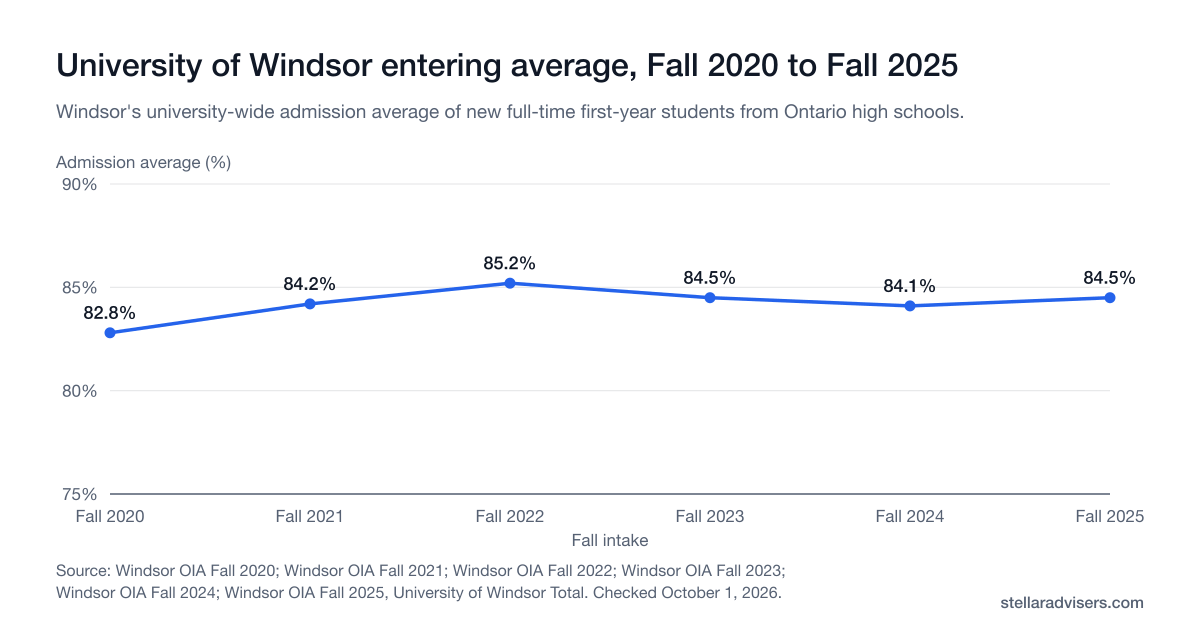
Windsor's entering average, Fall 2020 to Fall 2025
Each fall, the Office of Institutional Analysis reports the admission average of new, full-time, first-year students who came from Ontario high schools. The university-wide figure has stayed between 82.8% and 85.2% since Fall 2020.
Source: Windsor OIA Fall 2020; Windsor OIA Fall 2021; Windsor OIA Fall 2022; Windsor OIA Fall 2023; Windsor OIA Fall 2024; Windsor OIA Fall 2025, University of Windsor Total. Checked October 1, 2026. The axis starts at 75% so the changes are visible. These are averages of students who enrolled, not admission cut-offs. The Fall 2019 report has no university total, so the series starts in 2020.
Show the numbers
| Fall intake | Admission average (%) | Source |
|---|---|---|
| Fall 2020 | 82.8% | Windsor OIA Fall 2020 |
| Fall 2021 | 84.2% | Windsor OIA Fall 2021 |
| Fall 2022 | 85.2% | Windsor OIA Fall 2022 |
| Fall 2023 | 84.5% | Windsor OIA Fall 2023 |
| Fall 2024 | 84.1% | Windsor OIA Fall 2024 |
| Fall 2025 | 84.5% | Windsor OIA Fall 2025 |
| Faculty | Fall 2025 admission average |
|---|---|
| Nursing | 87.1% |
| Science | 86.5% |
| Engineering | 86.3% |
| Odette School of Business | 83.5% |
| Arts, Humanities and Social Sciences | 82.6% |
| Human Kinetics | 82.2% |
| University of Windsor total | 84.5% |
Across the university in Fall 2025, 4.1% of these students entered with 95% or higher, 18.5% with 90% to under 95%, 28.0% with 85% to under 90% and 24.2% with 80% to under 85%. Another 16.2% had 75% to under 80%, and 8.9% had 70% to under 75%.
These are averages of students who enrolled. They show where most of the class landed, not the lowest mark that got an offer.
Source: University of Windsor Office of Institutional Analysis, Fall 2020 to Fall 2025 admission averages.
Applicants and registrants by program (CUDO)
Windsor's latest Common University Data Ontario return covers Fall 2022. It counts first-choice applicants, everyone who listed the program anywhere on their application, and the students who registered. These totals include Ontario high school and other applicants.
| Program group | First-choice applicants | First-choice registrants | Applications (all choices) | Registrants (all choices) |
|---|---|---|---|---|
| Social Sciences | 409 | 143 | 1,979 | 257 |
| Psychology | 336 | 109 | 1,309 | 165 |
| Engineering and Applied Science | 317 | 89 | 1,448 | 178 |
| Commerce, Management and Business Admin | 312 | 117 | 1,460 | 186 |
| Biological and Biomedical Sciences | 296 | 105 | 1,397 | 219 |
| Health Professions and Related Programs | 288 | 99 | 1,430 | 187 |
| Computer and Information Science | 265 | 67 | 1,426 | 154 |
| Kinesiology, Recreation and Physical Education | 230 | 104 | 729 | 153 |
CUDO hides counts of five or fewer. When one cell in a row is hidden, the total is rounded to the nearest 3, so a few totals here are rounded.
Source: University of Windsor, Common University Data Ontario 2023, Section B1 (Fall 2022).
Why those counts don't make an acceptance rate
An acceptance rate is offers divided by applicants, for the same group and year. CUDO counts applicants and registrants, but not offers. Registrants divided by applicants shows who chose Windsor and enrolled, not who was admitted, so it would understate your chances.
So we don't publish a Windsor acceptance percentage. If you see one elsewhere, it didn't come from Windsor's own reports.
What actually decides admission
Your Grade 12 average in the program's required courses decides most offers. Use the faculty averages above as a planning range, then check the program's prerequisites and minimum in the Windsor admission requirements guide.
Windsor's CUDO return says first-year students can start in terms other than fall, depending on the program. For timing across Ontario, see when Ontario university offers come out.
Official sources
Each figure on this page links back to the page or report it came from.
- Windsor Office of Institutional Analysis: Fall 2025 admission averages (PDF)
Fall 2025 admission averages of new full-time first-year Ontario secondary school students: 84.5% overall, faculty averages and the share of students in each average band.
- Windsor Office of Institutional Analysis: admission averages by year
Index of the yearly admission-average PDFs from Fall 2016 to Fall 2025. The Fall 2020 to Fall 2024 university totals in the chart come from the PDFs listed here.
- University of Windsor CUDO 2023: Section B, admission
Fall 2022 first-choice applicants, applications and registrants by program (B1), entering-average ranges (B3) and the note that some programs admit in terms other than fall.
Frequently asked questions
Direct answers about Windsor's acceptance rate, its entering averages by faculty and how many students apply.
Planning a Windsor application?
An adviser can help you compare your average with these faculty figures and plan your program list. Windsor makes every admission decision.