Explore guide
Related resources
Browse all resourcesOn this page
Ontario Tech Acceptance Rate: What Official Data Shows
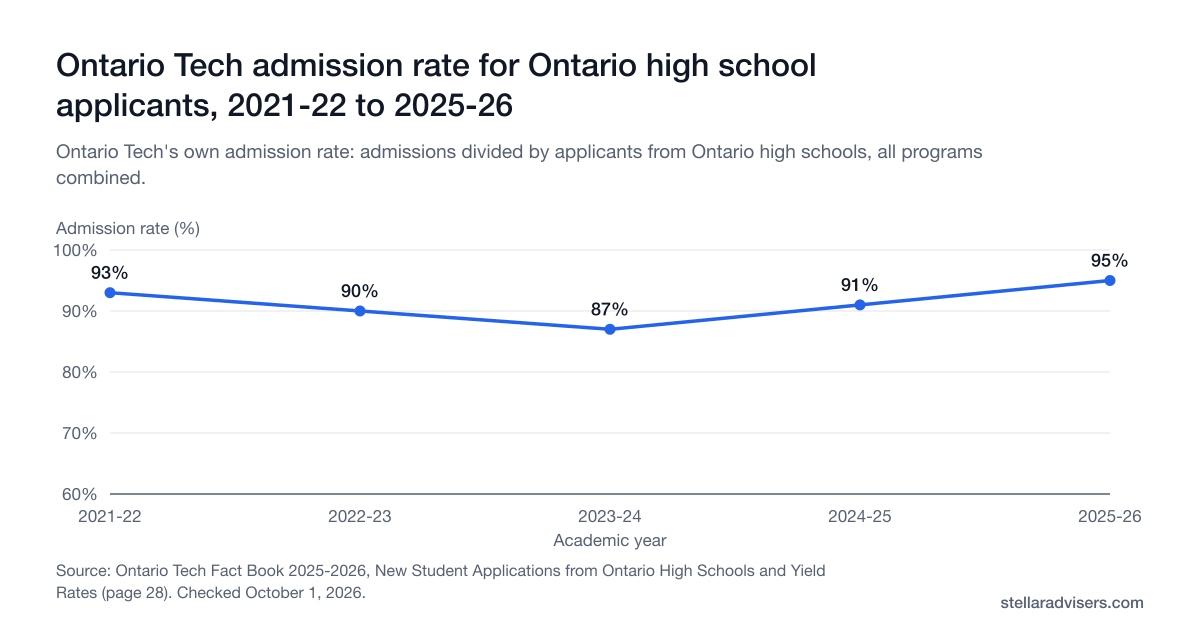
Ontario Tech admitted 95% of its Ontario high school applicants for 2025-26, by its own Fact Book. That's 9,626 admissions from 10,103 applicants. The same table covers every year since 2021-22, and a second table shows the average of the students who enrolled. Here's what the numbers cover and what they don't.
The short answer
- Ontario Tech admitted 95% of its Ontario high school applicants for 2025-26, by its own Fact Book. That's 9,626 admissions from 10,103 applicants.
- The rate counts only Ontario high school applicants. It doesn't include transfer, mature or international applicants.
- The Fact Book doesn't break the rate out by program. It can't tell you your odds in a specific program such as Nursing or Engineering.
- The average of new students who enrolled was 80.5% overall in 2025-26. By faculty, it ranged from 78.0% in Social Science and Humanities to 82.4% in Education.
- Ontario Tech says admission is competitive and the average needed varies from year to year. Meeting the minimum doesn't guarantee an offer.
Reviewed October 1, 2026 · Every figure below comes from Ontario Tech's own Fact Book or admissions pages, linked at the end
Save this to your free account
Keep these dates where you'll see them. The calendar file needs no account.
- OUAC Group A deadline (Ontario high-school students)January 15, 2027
Free account. No card needed.
Ontario Tech's admission rate, 2021-22 to 2025-26
Ontario Tech's Office of Institutional Research and Analysis publishes a Fact Book each year. Its table of new students from Ontario high schools counts applicants, admissions, confirmations and registrations. It then divides admissions by applicants and calls the result the admission rate.
Source: Ontario Tech Fact Book 2025-2026, New Student Applications from Ontario High Schools and Yield Rates (page 28). Checked October 1, 2026. The axis starts at 60% so the labels stay readable. The Fact Book prints the rate as a decimal (0.95); the chart shows the same value as a percentage. It covers Ontario high school applicants only and isn't broken out by program.
Show the numbers
| Academic year | Admission rate (%) |
|---|---|
| 2021-22 | 93% |
| 2022-23 | 90% |
| 2023-24 | 87% |
| 2024-25 | 91% |
| 2025-26 | 95% |
| Year | Applicants | Admissions | Admission rate | Confirmations | Registrations |
|---|---|---|---|---|---|
| 2021-22 | 6,248 | 5,784 | 93% | 1,433 | 1,415 |
| 2022-23 | 7,844 | 7,048 | 90% | 1,619 | 1,591 |
| 2023-24 | 9,294 | 8,130 | 87% | 1,778 | 1,741 |
| 2024-25 | 10,248 | 9,381 | 91% | 1,828 | 1,806 |
| 2025-26 | 10,103 | 9,626 | 95% | 2,005 | 2,005 |
Applicants grew from 6,248 to 10,103 over five years. The Fact Book's confirmation rate (confirmations divided by admissions) was 0.25 in 2021-22 and 0.20 in 2025-26, so most admitted students didn't confirm a place.
Source: Ontario Tech Fact Book 2025-2026 (June 2026), page 28.
What the admission rate covers
The rate counts students applying from Ontario high schools. It doesn't include transfer, mature or international applicants, and those groups can see a different picture.
It's also one figure for the whole university. The Fact Book doesn't break the rate out by program, so it can't tell you your odds in a specific program such as Nursing or Engineering. For that, look at the program's prerequisites and the average of last year's class below.
Average of new students by faculty
The Fact Book also reports the average of new students who enrolled, by faculty. These figures describe the class that arrived. They aren't cut-offs, and students below the average were admitted too.
| Faculty | 2021-22 | 2022-23 | 2023-24 | 2024-25 | 2025-26 |
|---|---|---|---|---|---|
| Business and Information Technology | 81.9% | 81.8% | 79.4% | 79.4% | 78.7% |
| Education | Not reported | Not reported | 82.4% | 81.1% | 82.4% |
| Engineering and Applied Science | 83.5% | 83.8% | 82.1% | 81.5% | 81.2% |
| Health Sciences | 86.5% | 85.3% | 82.4% | 81.4% | 81.3% |
| Science | 85.9% | 85.9% | 85.6% | 82.9% | 81.2% |
| Social Science and Humanities | 82.7% | 82.4% | 79.5% | 78.8% | 78.0% |
| Overall average | 84.2% | 84.0% | 82.0% | 81.1% | 80.5% |
The Fact Book notes that Education had no direct admissions before 2023-24, and that Energy Systems and Nuclear Science (85.3% in 2021-22 and 82.4% in 2022-23) became part of Engineering and Applied Science from 2023-24.
Source: Ontario Tech Fact Book 2025-2026, page 27. For program prerequisites and current cut-offs, see the Ontario Tech admission requirements guide.
What actually decides admission
Ontario Tech says admission is competitive and that the average needed varies from year to year. It looks at your marks, the mix of subjects you took and your results in the courses that matter for the program. Meeting the minimum doesn't guarantee an offer, and the strongest applicants get preference.
For Fall 2027, Ontario Tech says it will release decisions on a regular basis starting in January 2027. Your offer letter gives the date to accept. For timing across all Ontario universities, see when Ontario university offers come out.
Official sources
Each figure on this page links back to the page or report it came from.
- Ontario Tech Fact Book 2025-2026 (PDF)
Applicants, admissions, confirmations, registrations and the admission rate for new students from Ontario high schools, 2021-22 to 2025-26 (page 28), and new student admission averages by faculty (page 27). Published June 2026.
- Ontario Tech Office of Institutional Research and Analysis: Fact Book
The office's list of Fact Book editions, with 2025-2026 as the latest. Earlier editions go back to 2009-10.
- OUAC 2026-2027 schedule of dates
May 28, 2027 is the latest date Ontario high school students who applied by January 15 can expect a response; June 1, 2027 is the earliest date they can be required to respond.
- Ontario Tech: Ontario high school applicants
Admission is competitive and the required average varies by year; Fall 2027 decisions are released on a regular basis from January 2027.
Frequently asked questions
Direct answers about Ontario Tech's admission rate, how many students apply, and the averages of the students who enrol.
Planning an Ontario Tech application?
An adviser can help you check prerequisites and build a program list around these numbers. Ontario Tech makes every admission decision.