Explore guide
Related resources
Browse all resourcesOn this page
University of Manitoba Acceptance Rate: What Official Data Shows
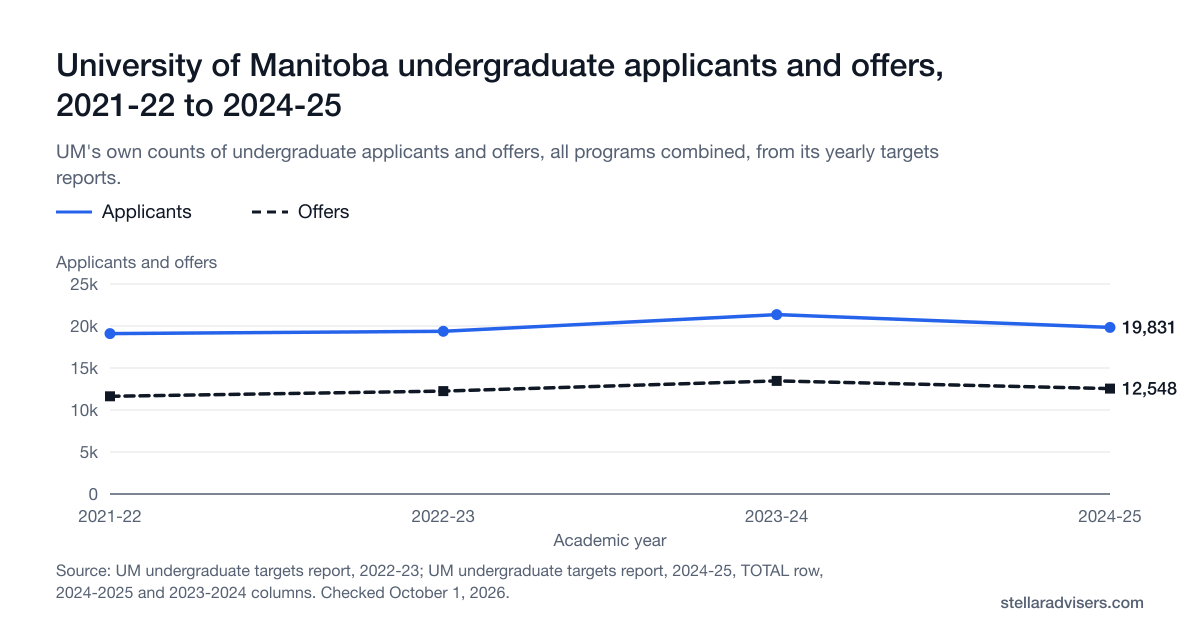
The University of Manitoba made 12,548 undergraduate offers to 19,831 applicants in 2024-25, by its own targets report. That works out to about 63%, by our arithmetic. The same report breaks offers out by program, and that's where the useful detail is: University 1 offered a place to most applicants, while Health Sciences offered one to about 1 in 9.
The short answer
- In 2024-25, the University of Manitoba made 12,548 offers to 19,831 applicants, by its own targets report.
- That's about 63% by our arithmetic. Manitoba publishes the counts, not a rate.
- University 1 made 4,603 offers to 5,648 applicants, about 81.5%.
- Direct-entry Health Sciences made 52 offers to 453 applicants, about 11.5%.
- For 2026-27, direct-entry Science and Engineering need an 80% minimum, and Commerce needs 85%.
Reviewed October 1, 2026 · Every count below comes from the University of Manitoba's Office of Institutional Analysis or admissions pages, linked at the end
Save this to your free account
Track University of Manitoba with a checklist for how you apply.
Free account. No card needed.
Applicants and offers, 2021-22 to 2024-25
The Office of Institutional Analysis publishes a yearly report of undergraduate targets, applicants, offers, acceptances and registrations for every program. The totals below add up every program in that report.
Source: UM undergraduate targets report, 2022-23, TOTAL row, 2022-2023 and 2021-2022 columns; UM undergraduate targets report, 2024-25, TOTAL row, 2024-2025 and 2023-2024 columns. Checked October 1, 2026. Totals mix direct entry, University 1 and professional programs such as Medicine and Law. UM publishes the counts, not a rate.
Show the numbers
| Academic year | Applicants (Applicants and offers) | Offers (Applicants and offers) | Source |
|---|---|---|---|
| 2021-22 | 19,100 | 11,629 | UM undergraduate targets report, 2022-23 |
| 2022-23 | 19,365 | 12,246 | UM undergraduate targets report, 2022-23 |
| 2023-24 | 21,352 | 13,466 | UM undergraduate targets report, 2024-25 |
| 2024-25 | 19,831 | 12,548 | UM undergraduate targets report, 2024-25 |
| Year | Applicants | Offered | Accepted | Registered |
|---|---|---|---|---|
| 2021-22 | 19,100 | 11,629 | 9,864 | 8,857 |
| 2022-23 | 19,365 | 12,246 | 10,114 | 7,995 |
| 2023-24 | 21,352 | 13,466 | 11,414 | 8,596 |
| 2024-25 | 19,831 | 12,548 | 9,639 | 8,552 |
Offers divided by applicants was about 61% in 2021-22 and about 63% in each of the next three years (our arithmetic from the published totals). Registered counts students enrolled on November 1.
Source: University of Manitoba Office of Institutional Analysis, undergraduate targets reports for 2022-23 and 2024-25 (each covers two years).
Offers by program, 2024-25
The university-wide total mixes direct-entry programs with University 1, programs you enter after some university study, and professional programs such as Medicine and Law. For high school applicants, the direct-entry rows are the ones to read.
| Program | Applicants | Offered | Offers per applicant (our calculation) |
|---|---|---|---|
| University 1 | 5,648 | 4,603 | 81.5% |
| Science, direct entry | 1,953 | 1,486 | 76.1% |
| Arts, direct entry | 888 | 634 | 71.4% |
| Engineering, direct entry | 920 | 496 | 53.9% |
| Asper School of Business, direct entry | 842 | 421 | 50.0% |
| Nursing, Fort Garry campus, fall term | 337 | 132 | 39.2% |
| Kinesiology, direct entry | 202 | 77 | 38.1% |
| Health Sciences, direct entry | 453 | 52 | 11.5% |
| All undergraduate programs | 19,831 | 12,548 | 63.3% |
Each percentage is the program's published offers divided by its published applicants, for the same program and year. Manitoba doesn't publish these percentages itself, and a program's rate moves from year to year: Health Sciences offered 48 places to 409 applicants in 2023-24.
Source: University of Manitoba undergraduate targets report, 2024-25.
Direct-entry minimum averages for 2026-27
UM publishes a minimum average for each direct-entry program, calculated over specific Manitoba Grade 12 (40S) courses. Ontario and other applicants use equivalent courses. A minimum makes you eligible. It doesn't promise a place where a program has more qualified applicants than seats.
| Program | Minimum average | Lowest mark allowed in each course |
|---|---|---|
| Arts (BA) | 70% | 60% |
| Science (BSc) | 80% | 60% |
| Engineering (BSc in Engineering) | 80% | 70% |
| Commerce, Asper School of Business | 85% | 70% |
| Kinesiology | 85% | 60% |
Source: University of Manitoba direct-entry admission requirements (2026-2027). For Ontario course equivalents and deadlines, see the University of Manitoba admissions guide.
Official sources
Each figure on this page links back to the page or report it came from.
- UM Office of Institutional Analysis: undergraduate targets report, 2024-25 (PDF)
Applicants, offers, acceptances and registrations by program for 2024-25 and 2023-24, with university totals. Report dated September 18, 2025.
- UM Office of Institutional Analysis: undergraduate targets report, 2022-23 (PDF)
Applicants, offers, acceptances and registrations by program for 2022-23 and 2021-22, with university totals.
- UM Office of Institutional Analysis: enrolment reports
The office's list of targets reports. The 2024-25 report is the latest posted, alongside the 2023-24 and 2022-23 reports.
- UM direct-entry admission requirements
Program minimum averages and course minimums for 2026-2027 direct-entry programs, including Arts, Science, Engineering, Commerce and Kinesiology.
Frequently asked questions
Direct answers about UM's offers and applicants, how selective each program is, and the minimum averages.
Planning a University of Manitoba application?
An adviser can help you choose between University 1 and direct entry and plan around these numbers. UM makes every admission decision.