Explore guide
Related resources
Browse all resourcesOn this page
University of Alberta Acceptance Rate: 68.5% (2023/24 Enrolment Report)
U of A admitted 27,770 of 40,532 undergraduate applicants in 2023/24, a 68.5% admission rate by its own report. The University of Alberta admitted 68.5% of its undergraduate applicants in 2023/24: 27,770 of 40,532, according to its own 2023/24 Undergraduate and Graduate Enrolment Report. That rate combines every faculty, and it’s the newest public year: later enrolment reports open only for people signed in with a University of Alberta CCID. The U of A also publishes an admission-average range for every faculty, from the low 70s at Augustana to the mid 90s in Science. Here is what is public, how the rate is calculated, and what decides a U of A offer.
The short answer
- In 2023/24, the U of A admitted 27,770 of 40,532 undergraduate applicants.
- That is a 68.5% admission rate, by the U of A's own report.
- The rate covers every faculty. It also counts current students who change programs.
- Faculty ranges run from the low 70s at Augustana to the mid 90s in Science.
- The ranges come from the past three admission cycles. They are not a promise for your year.
Reviewed October 8, 2026 · Alberta applies through ApplyAlberta, not Ontario’s OUAC, and CUDO has no Alberta equivalent, so those sources do not apply here
Save this to your free account
Keep these dates where you'll see them. Free account; we email you before each saved date; unsubscribe any time. Your account’s email pause still applies. The calendar file needs no account.
- University of Alberta, most programsMarch 1, 2027
Free account. No card needed.
What the University of Alberta publishes
The U of A’s admissions pages frame admission around competitiveness and capacity, not a percentage. Its admission requirements page states plainly:
“Admission to all undergraduate programs at the University of Alberta is competitive and subject to availability of space.” And: “Meeting the minimum or competitive average does not guarantee admission, and space in each program is limited.”
For planning, the U of A’s Competitive Requirements page publishes an admission-average range for each faculty and program. That page states the ranges “reflect the past three admission cycles.” They are a record of where admitted students landed recently, not a promise about the cycle you are applying in.
The U of A’s official Student Service Centre FAQ carries a full admissions section covering how to apply, checking application status, changing programs, and accepting an offer. It contains no acceptance-rate, admission-rate, or chance-of-admission answer anywhere.
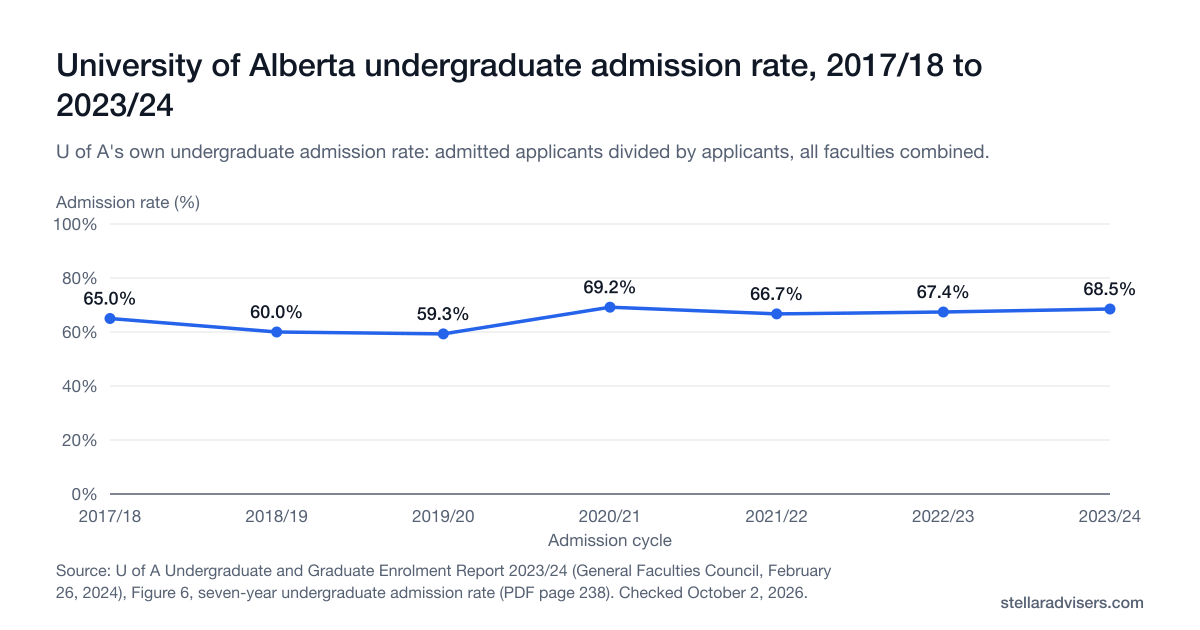
The U of A’s admission rate, 2017/18 to 2023/24
The U of A’s 2023/24 Undergraduate and Graduate Enrolment Report counted 40,532 undergraduate applicants, 27,770 admitted and 14,439 registered, and charted its admission rate for seven cycles. The rate uses December 1 data and includes current students applying to change programs.
Source: U of A Undergraduate and Graduate Enrolment Report 2023/24 (General Faculties Council, February 26, 2024), Figure 6, seven-year undergraduate admission rate (PDF page 238). Reviewed October 2, 2026. The rate uses December 1 data and includes current students applying to change programs. U of A's newer reports now need a university login, so later years could not be checked.
Show the numbers
| Admission cycle | Admission rate (%) |
|---|---|
| 2017/18 | 65.0% |
| 2018/19 | 60.0% |
| 2019/20 | 59.3% |
| 2020/21 | 69.2% |
| 2021/22 | 66.7% |
| 2022/23 | 67.4% |
| 2023/24 | 68.5% |
Newer figures exist but the university keeps them behind a login. The Office of the Registrar describes maintaining “Applicant Statistics and Enrolment Management Reports” with the Strategic Analysis Office, served as Acorn Tableau dashboards. To open them, its own page says, “You must be logged into your University of Alberta email/apps account in the browser you are using.” The annual enrolment reports for 2024-25 and 2025-26 now link to a document store that asks for the same login, so the 2023/24 report, printed in public General Faculties Council meeting materials, is the latest one we could read.
The Office of the Provost’s Institutional Data and Analytics and Strategic Analysis pages point to the same internal Acorn Tableau environment, gated by a CCID login and a signed ACORN Confidentiality Agreement. Program-level applicant and offer counts are not public, so the rate above is the only official percentage, and it covers every program combined.
| Admissions metric | Status | Where it lives |
|---|---|---|
| University-wide undergraduate admission rate | Published to 2023/24 | The 2023/24 Undergraduate and Graduate Enrolment Report, printed in public General Faculties Council materials, gives 68.5% and a seven-year trend. Newer reports need a CCID login. |
| Applications received, by program | Compiled, but not public | The Office of the Registrar's Applicant Statistics and Enrolment Management Reports exist, but require a University of Alberta email/apps login (CCID) through Acorn Tableau. |
| Offers of admission, by program | Compiled, but not public | Held in the same CCID-restricted Applicant Statistics reports. No public extract is offered. |
| Admission-average range, by faculty | Published | The Competitive Requirements page publishes a range per faculty and program reflecting the past three admission cycles. |
| Enrolled students | Published | 46,201 students across 5 campuses and 17 faculties, on the U of A facts and figures page. |
| Undergraduate enrolment split | Published | 35,290 full-time and 2,445 part-time undergraduates, alongside 6,865 full-time and 1,601 part-time graduate students. |
| Degrees granted | Published | 9,458 graduates in 2023-24: 6,814 undergraduate and 2,644 graduate. |
The enrolment figures above are internally consistent on the U of A’s own facts page: 35,290 full-time and 2,445 part-time undergraduates plus 6,865 full-time and 1,601 part-time graduate students total exactly the 46,201 students the university reports. None of these are applicant or offer counts. They describe students already enrolled.
How the U of A gets this number
The 68.5% is the U of A’s own figure, printed in its 2023/24 Undergraduate and Graduate Enrolment Report. We did not calculate it. The numerator is undergraduate applicants admitted (27,770). The denominator is total undergraduate applicants, counted once each (40,532). Both use the university’s December 1, 2023 data. 27,770 divided by 40,532 is 68.5%, which matches the report.
What it is not: it is not a rate for one program, and it is not limited to Grade 12 students. It combines every faculty and includes current students applying to change programs. The U of A has newer reports for 2024-25 and 2025-26, but they need a university login, so we could not check them.
Admission averages by faculty
These are the ranges the U of A publishes on its Competitive Requirements page, reflecting the past three admission cycles. The spread runs from the low 70s to the mid 90s, which is why one university-wide number tells you little about a single program. These ranges were read on October 8, 2026.
| Faculty or program | Published admission-average range | What to know |
|---|---|---|
| Agricultural, Life + Environmental Sciences | Low 70s to low 80s | One of the more accessible ranges, and a common second choice. |
| Arts | Low to mid 70s | Criminology is high 80s to low 90s, BA Honors mid 80s to low 90s, BA (Planning) low to mid 80s, and the BA (Drama)/BEd Secondary combined route low to high 80s. |
| Augustana (Camrose) | Low 70s | Among the lowest published ranges at the university. |
| Business (Alberta School of Business) | Mid to high 80s | Direct entry from high school. |
| Campus Saint-Jean | Low 70s | Bilingual Nursing averages are listed under Nursing. |
| Education | Elementary mid 70s to low 80s; Secondary low 70s to mid 90s | Secondary (Art, Drama, Music) is low 70s to low 80s. Other secondary subjects run up to the mid 90s. |
| Engineering | Mid 80s to low 90s | Admission is to a common first year; you choose a discipline afterwards. |
| Kinesiology, Sport + Recreation | Mid to high 80s | BKin/BEd combined is mid 80s to low 90s; BA in Recreation, Sport and Tourism is mid to high 70s. |
| Native Studies | Low to mid 70s | Direct entry from high school. |
| Nursing | High 80s to low 90s | The Bilingual BScN program is mid 80s to low 90s. |
| Science | Low 80s to mid 90s | The widest range at the university. The new Bachelor of Health Sciences has no three-year average yet. |
These are historical ranges, not cut-offs or guarantees. For the full requirement set, the five required Grade 12 subjects, language requirements, and Fall 2027 deadlines, see our University of Alberta admission requirements guide.
What actually determines a U of A offer
The campus-wide rate tells you how most applicants fare. For your own offer, four things from the U of A’s admissions pages matter more.
Your average is program-specific. The U of A calculates a competitive average from the courses required for the program you applied to, not from your whole transcript. The same student can be competitive for one faculty and not another in the same application.
The bar moves during the cycle. The Competitive Requirements page explains that the U of A assesses applications on an ongoing basis, which “creates an opportunity to adjust what is considered a competitive application throughout the admissions period (October 1 - August 31)” based on the number of qualified applicants to a program, the averages presented by applicants that year, and program capacity.
Timing is a real variable. Because assessment is rolling rather than batched, the U of A tells applicants to begin on October 1 of their Grade 12 year for the best chance at admission. Applying late in a cycle means competing for whatever space remains.
Your second choice only matters if your first fails. New applicants may select up to two program choices per application. The U of A evaluates the first choice first; if you are eligible for it you receive that offer and are never evaluated for the second, whether or not you accept. The second choice is assessed only if you are ineligible for the first. That makes pairing a reach program with a realistic one a real decision.
Official sources
Every figure and quotation on this page links back to the University of Alberta page it came from. No third-party estimate is used anywhere on this page.
- Undergraduate and Graduate Enrolment Report 2023/24 (General Faculties Council materials, February 26, 2024)
The U of A's own 2023/24 undergraduate admission rate (68.5%: 40,532 applicants, 27,770 admitted, 14,439 registered) and its seven-year admission-rate figure from 2017/18, read October 8, 2026.
- Competitive Requirements: admission averages by faculty
The U of A's admission-average range for every faculty and program, its statement that these ranges reflect the past three admission cycles, and its explanation that a competitive application is adjusted through the October 1 to August 31 admissions period. Read October 8, 2026.
- Admission Requirements: five subjects, averages, and fees
The U of A's own statements that admission to all undergraduate programs is competitive and subject to availability of space, and that meeting the minimum or competitive average does not guarantee admission. Read October 8, 2026.
- How to Apply: program choices and evaluation order
The two-program-choice rule for new applicants, the first-choice-then-second-choice evaluation order, and the U of A's advice to begin on October 1 of Grade 12 for the best chance at admission. Read October 8, 2026.
- Facts and figures: faculties, campuses, and class sizes
Enrolment and graduate counts used on this page (46,201 students, 17 faculties, 5 campuses, 9,458 graduates in 2023-24), and confirmation that this page carries no applicant, offer, or acceptance-rate figure. Read October 8, 2026.
- Applicant + Enrolment Reporting (Office of the Registrar)
Confirms the U of A's Applicant Statistics and Enrolment Management Reports exist and are delivered as Acorn Tableau dashboards, and that "You must be logged into your University of Alberta email/apps account" to open them. Read October 8, 2026.
- Undergraduate + Graduate Enrolment Report
The U of A's annual enrolment reports back to 2013-14, with its own note that "reports are only available to those with a University of Alberta CCID." Read October 8, 2026.
- Institutional Data and Analytics (Office of the Provost)
Confirms the U of A's institutional-data office delivers business-intelligence reporting through Tableau dashboards, and links to no public dashboard, fact book, or common data set. Read October 8, 2026.
- Strategic Analysis
Confirms institutional reporting runs through Acorn Tableau behind a CCID login and an ACORN Confidentiality Agreement, with no public reporting product offered. Read October 8, 2026.
- Student Service Centre FAQ
The U of A's official prospective-student FAQ. Its admissions section answers questions on applying, application status, program changes, and offer acceptance, and contains no acceptance-rate, admission-rate, or chance-of-admission answer. Read October 8, 2026.
Frequently asked questions
Direct answers about the University of Alberta's admission rate, the applicant statistics it keeps behind a CCID login, and the faculty admission averages it publishes.
Planning a University of Alberta application?
A peer adviser who has been through U of A admissions can help you pair your two program choices and time your application. The University of Alberta is the only official source for admission decisions.