Explore guide
Related resources
Browse all resourcesOn this page
McGill University Acceptance Rate: What Official Data Shows
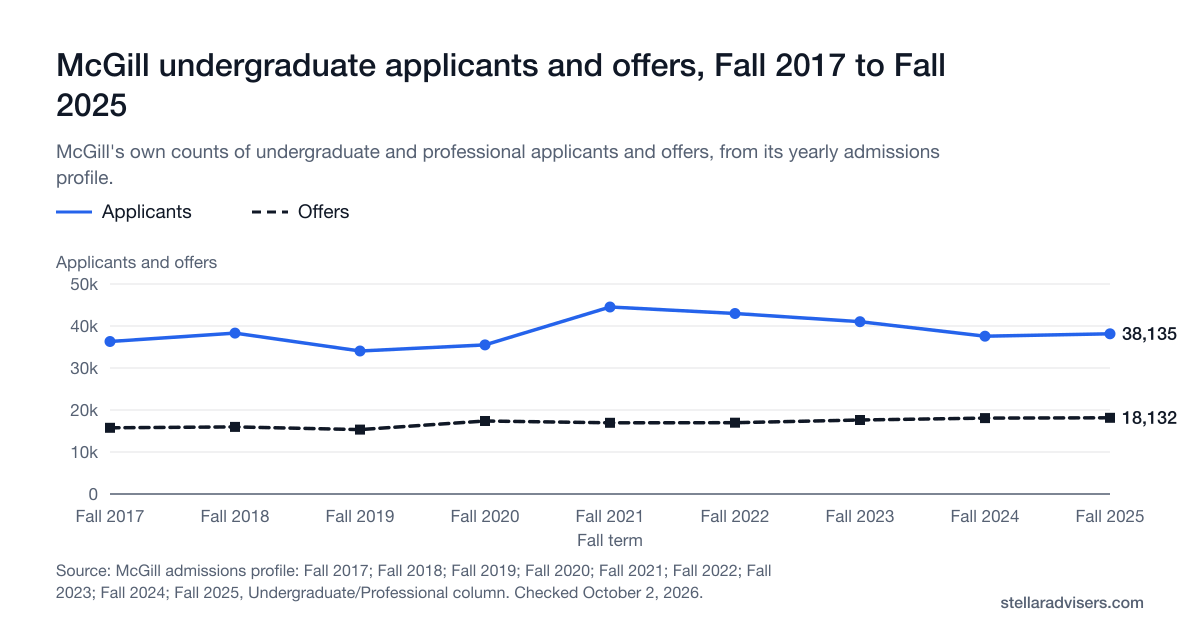
McGill's Fall 2025 profile shows 38,135 applicants and 18,132 offers: a 47.5% rate we calculated. By our calculation from McGill's Fall 2025 Admissions Profile, 47.5% of undergraduate applicants got an offer: 18,132 offers for 38,135 applicants. McGill’s Enrolment Services publishes the applicant, offer and entering-class counts every term, but it doesn’t label any of them a rate. Every count below is McGill’s own, with the page it came from. The percentages are our arithmetic on those counts, and the method is shown below.
The short answer
- McGill's Fall 2025 profile shows 18,132 offers for 38,135 applicants. That is 47.5% by our count, not a figure McGill states.
- One in two applicants may sound likely, but the rate includes every background and every program. It also includes certificates and diplomas.
- Quebec CEGEP (a Quebec college most Quebec students attend before university) applicants follow separate curriculum rules. So do IB (the International Baccalaureate diploma) and others.
- For Ontario applicants, programs publish typical minimum Top 6 ranges. Arts sits at high 80s to low 90s, while Management (BCom) is mid 90s Top 6.
- McGill revises these ranges between cycles. Confirm the current range on the live program page before you apply.
Reviewed October 8, 2026 · McGill revises published admission ranges between cycles, so confirm the current range on the live program page before applying
Save this to your free account
Keep these dates where you'll see them. Free account; we email you before each saved date; unsubscribe any time. Your account’s email pause still applies. The calendar file needs no account.
- McGill, Canadian high schools outside QuebecFebruary 1, 2027
Free account. No card needed.
Official program-by-program admission ranges
For Ontario high school applicants, McGill’s requirements pages publish a typical minimum Top 6 range and prerequisites for each program, checked October 1, 2026. McGill shows no year for these ranges and says minimum grades change from year to year, so they are not guaranteed future cut-offs. Quebec CEGEP, IB, A-Level, CAPE, and U.S. applicants follow separate curriculum-specific requirements not shown here.
| Program (Ontario applicants) | Typical minimum Top 6 range | Ontario prerequisites |
|---|---|---|
| Arts | High 80s to low 90s Top 6; high 80s to low 90s in English or French | 4U English or French |
| Management (BCom) | Mid 90s Top 6; low to mid 90s in math; high 80s to low 90s in English or French | 4U English or French, plus Calculus and Vectors |
| Biological, Biomedical and Life Sciences Group | Low to mid 90s Top 6; low 90s in math and science | 4U English or French, Calculus and Vectors, plus two of Biology, Chemistry, or Physics |
| Physical, Environmental, Math and Computer Sciences Group | Low 90s Top 6; high 80s to low 90s in math and science | 4U English or French, Calculus and Vectors, plus two of Biology, Chemistry, or Physics |
| Civil Engineering | Low to mid 90s Top 6; low 90s in math and science | 4U English or French, Calculus and Vectors, Physics, and Chemistry |
| Electrical Engineering | Mid to high 90s Top 6; mid 90s in math and science | 4U English or French, Calculus and Vectors, Physics, and Chemistry |
| Mechanical Engineering | Mid to high 90s Top 6; mid 90s in math and science | 4U English or French, Calculus and Vectors, Physics, and Chemistry |
| Software Engineering | Low to mid 90s Top 6; low to mid 90s in math and science | 4U English or French, Calculus and Vectors, Physics, and Chemistry |
Source: McGill University admission requirements by educational background. McGill says meeting a listed range does not guarantee admission.
Applicants, offers and entering class, Fall 2017 to Fall 2025
McGill’s Enrolment Services publishes an “Admissions Profile” every term. Its Undergraduate/Professional column counts applicants, offers and the entering class. McGill never labels a column “acceptance rate”. The two right-hand columns below are ratios Stellar Advisers calculated from McGill’s own counts, not figures McGill states.
Source: McGill admissions profile: Fall 2017; Fall 2018; Fall 2019; Fall 2020; Fall 2021; Fall 2022; Fall 2023; Fall 2024; Fall 2025, Undergraduate/Professional column. Reviewed October 2, 2026. Totals include degrees, certificates and diplomas, and count each applicant once even if they applied to several faculties. McGill publishes the counts, not a rate.
Show the numbers
| Fall term | Applicants (Applicants and offers) | Offers (Applicants and offers) | Source |
|---|---|---|---|
| Fall 2017 | 36,304 | 15,771 | McGill admissions profile: Fall 2017 |
| Fall 2018 | 38,320 | 15,986 | Fall 2018 |
| Fall 2019 | 34,047 | 15,323 | Fall 2019 |
| Fall 2020 | 35,505 | 17,385 | Fall 2020 |
| Fall 2021 | 44,534 | 16,955 | Fall 2021 |
| Fall 2022 | 42,968 | 16,968 | Fall 2022 |
| Fall 2023 | 41,017 | 17,620 | Fall 2023 |
| Fall 2024 | 37,568 | 18,063 | Fall 2024 |
| Fall 2025 | 38,135 | 18,132 | Fall 2025 |
| Term | Applicants | Offers | Entering class | Derived admit rate | Derived yield rate |
|---|---|---|---|---|---|
| Fall 2025 | 38,135 | 18,132 | 7,310 | 47.5% | 40.3% |
| Fall 2024 | 37,568 | 18,063 | 7,180 | 48.1% | 39.7% |
| Fall 2023 | 41,017 | 17,620 | 6,728 | 43.0% | 38.2% |
| Fall 2022 | 42,968 | 16,968 | 6,397 | 39.5% | 37.7% |
| Fall 2021 | 44,534 | 16,955 | 6,351 | 38.1% | 37.5% |
| Fall 2020 | 35,505 | 17,385 | 6,878 | 49.0% | 39.6% |
| Fall 2019 | 34,047 | 15,323 | 6,384 | 45.0% | 41.7% |
| Fall 2018 | 38,320 | 15,986 | 6,422 | 41.7% | 40.2% |
| Fall 2017 | 36,304 | 15,771 | 6,548 | 43.4% | 41.5% |
Source: McGill Admissions Profile, Fall 2017 to Fall 2025 editions, re-read October 8, 2026. McGill states its applicant total is deduplicated across faculties, not a sum of per-faculty counts, and includes degrees, certificates and diplomas.
How we got this number
Our calculation is offers divided by applicants, both from the Undergraduate/Professional column of McGill’s Fall 2025 (Final) Admissions Profile: 18,132 ÷ 38,135 = 47.5%. The derived yield is the entering class divided by offers: 7,310 ÷ 18,132 = 40.3%.
McGill counts each applicant once in that total, even if they applied to more than one faculty, so 47.5% is a share of people, not of applications. It mixes every applicant background (Quebec CEGEP, other provinces, the U.S. and overseas) and includes certificates and diplomas as well as degrees. It excludes special, visiting and exchange students.
What it is not: McGill’s own rate, a rate for your program, or a rate for Ontario applicants. McGill doesn’t publish offers by faculty or by applicant background, so those rates can’t be calculated.
Fall 2025 demand by faculty
McGill publishes applicants and registered students by admissions unit, but not offers. The only offer figure is the total in the table above. So no faculty acceptance rate can be calculated from McGill’s own data.
| Faculty | Applicants | Registered students |
|---|---|---|
| Arts | 10,845 | 2,204 |
| Science | 10,354 | 1,348 |
| Engineering | 8,188 | 1,028 |
| Management | 7,278 | 736 |
| Medicine and Health Sciences | 2,764 | 249 |
| Interfaculty, B.A. & Sc. | 2,246 | 185 |
| Education | 1,978 | 467 |
| Agricultural and Environmental Sciences | 1,689 | 289 |
| Law | 1,473 | 204 |
| Nursing | 1,130 | 351 |
| Dental Medicine and Oral Health Sciences | 829 | 45 |
| Physical and Occupational Therapy | 524 | 87 |
| Music | 491 | 117 |
Source: McGill Admissions Profile, Fall 2025 (Final), re-read October 8, 2026. McGill states the applicant total across faculties is not a simple sum of the rows above, since an applicant to more than one admissions unit is counted once in the Total Undergraduate figure.
What actually determines McGill admission
The ranges above are typical minimums, not guaranteed cut-offs. McGill evaluates each applicant against the rules for their educational background (Ontario Top 6, Quebec CEGEP R-score, IB, A-Level, CAPE or U.S. curriculum) and reviews prerequisite courses within that calculation. McGill’s most demanding published ranges are in Engineering, where Ontario Top 6 ranges run from the low to mid 90s (Software and Civil Engineering) to the mid to high 90s (Electrical and Mechanical Engineering), above the high 80s to low 90s Arts range.
For deadlines, English and French proficiency, testing policy, and the full requirements selector by educational background, see the complete McGill admission requirements guide.
Official sources
Every figure on this page links back to the McGill source it came from.
- Admissions Profile: Fall 2025 (Final)
McGill's own Undergraduate/Professional applicants (38,135), offers (18,132) and entering class (7,310) for Fall 2025, plus applicants and registered students by admissions unit. Re-read October 8, 2026.
- Admissions Profile: Fall 2024 (Final)
McGill's Fall 2024 applicants (37,568), offers (18,063) and entering class (7,180). Re-read October 8, 2026.
- Admissions Profile: Fall 2023 (Final)
McGill's Fall 2023 applicants (41,017), offers (17,620) and entering class (6,728). Re-read October 8, 2026.
- Admissions Profile archive: Fall 2017 to Fall 2022
One of McGill's yearly Admissions Profile pages. The Fall 2017 to Fall 2022 editions each have their own page, linked from the chart, and each was re-read October 8, 2026.
- Enrolment Services: enrolment reports
McGill's enrolment reports are headcounts of students based on an October 15 census. They carry no application or offer counts, so the Admissions Profile is the source for those.
- Admission requirements by educational background
McGill's program-by-program admission requirements selector, organized by the applicant's educational background.
- Ontario high school requirements and typical Top 6 ranges
The current published Ontario admission-range table reused on this page, and McGill's statement that grades equal to or better than those listed do not guarantee admission. Re-read October 8, 2026.
- McGill quick facts
McGill's total enrolled undergraduate headcount (28,167 for Fall 2025) for overall context. That is a different figure from the admissions counts above.
Frequently asked questions
Direct answers about McGill's own applicant, offer and entering-class counts, the rate we calculated from them, and what McGill doesn't publish.
Planning a McGill application?
A peer adviser who has been through McGill admissions can help you plan your program choice and application. McGill is the only official source for admission decisions.