Explore guide
Related resources
Browse all resourcesOn this page
UBC Acceptance Rate: 60% Vancouver, 76% Okanagan (2025/26)
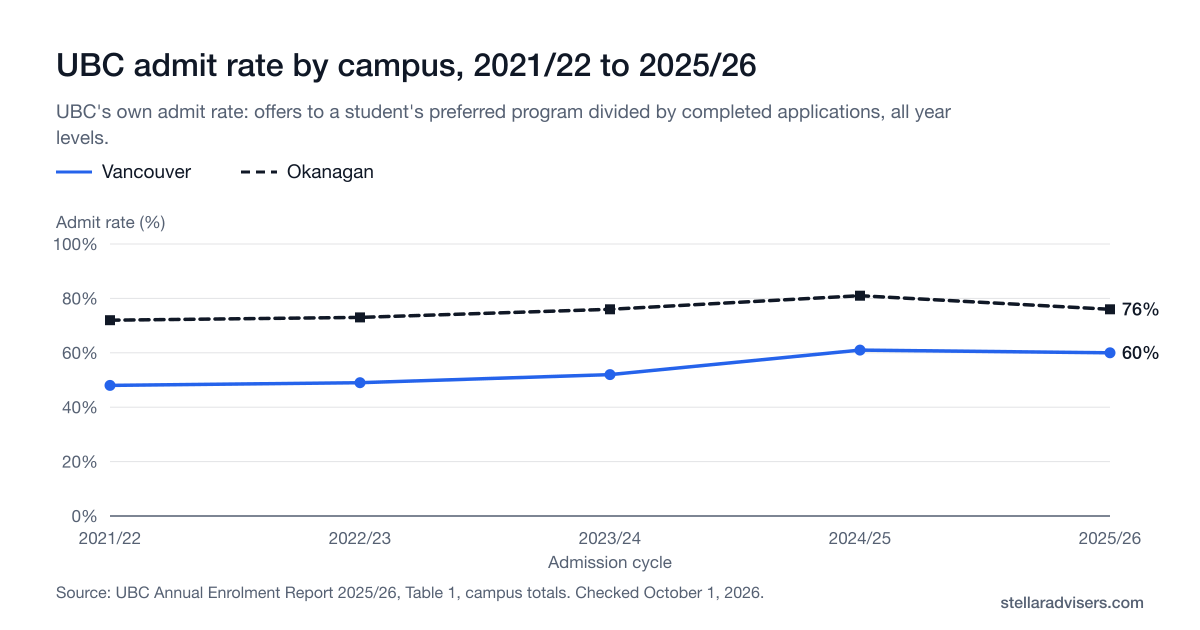
UBC's own admit rate for 2025/26: 60% at Vancouver (55% domestic, 71% international) and 76% at Okanagan, from UBC's 2025/26 Annual Enrolment Report. UBC’s own admit rate for 2025/26 was 60% at the Vancouver campus and 76% at the Okanagan campus, according to UBC’s Annual Enrolment Report 2025/26. UBC calls this its “Admit Rate”: offers of admission divided by completed applications. It reports the rate by campus and by domestic and international applicants, not as one blended number. Every figure below comes from that UBC report or another official UBC page. Nothing here is estimated.
The short answer
- For 2025/26, UBC's Vancouver campus had a 60% admit rate and Okanagan had 76%.
- Vancouver's rate breaks down to 55% for domestic and 71% for international applicants.
- Okanagan's rate breaks down to 75% for domestic and 82% for international applicants.
- UBC calls this its Admit Rate: offers of admission divided by completed applications.
- The rate is not for one program and includes transfer students, not just Grade 12 applicants.
Reviewed October 8, 2026 · Figures are UBC’s own published numbers. Confirm the latest edition on UBC’s Planning and Institutional Research site before citing them elsewhere
Save this to your free account
Keep these dates where you'll see them. Free account; we email you before each saved date; unsubscribe any time. Your account’s email pause still applies. The calendar file needs no account.
- UBC application deadline (11:59 p.m. PST)January 15, 2027
Free account. No card needed.
UBC’s official admit rate, by campus and citizenship
UBC defines the admit rate as the ratio of students offered admission to their preferred program choice to the number of completed applications received that year. UBC reports six separate figures every year, not one blended, university-wide number.
Source: UBC Annual Enrolment Report 2025/26, Table 1, campus totals. Reviewed October 1, 2026. UBC's report says its admissions system changed for 2024/25, and Vancouver data from then on include post-baccalaureate programs and some diplomas and certificates.
Show the numbers
| Admission cycle | Vancouver (Admit rate (%)) | Okanagan (Admit rate (%)) |
|---|---|---|
| 2021/22 | 48% | 72% |
| 2022/23 | 49% | 73% |
| 2023/24 | 52% | 76% |
| 2024/25 | 61% | 81% |
| 2025/26 | 60% | 76% |
| Cycle | Vancouver domestic | Vancouver international | Vancouver total | Okanagan domestic | Okanagan international | Okanagan total |
|---|---|---|---|---|---|---|
| 2021/22 | 51% | 45% | 48% | 71% | 73% | 72% |
| 2022/23 | 47% | 51% | 49% | 73% | 72% | 73% |
| 2023/24 | 50% | 56% | 52% | 77% | 73% | 76% |
| 2024/25 | 58% | 68% | 61% | 81% | 80% | 81% |
| 2025/26 | 55% | 71% | 60% | 75% | 82% | 76% |
Source: UBC Annual Enrolment Report 2025/26, Planning and Institutional Research (PAIR). UBC also publishes a companion “yield rate” (registered students ÷ students offered admission) in the same report; see the full PDF linked in Official sources below for that table.
How UBC gets this number
The 60% and 76% are UBC’s own figures, copied from Table 1 of its Annual Enrolment Report 2025/26. We did not calculate them. UBC divides the number of applicants offered admission to their first-choice program (the numerator) by the number of completed applications (the denominator). Completed applications include students turned down for missing a required course and students turned down for lack of space.
You can check it with the counts in the next table. At Vancouver, 15,677 domestic and 9,455 international admits make 25,132 offers, out of 28,478 plus 13,267, or 41,745 completed applications: about 60%. At Okanagan, 3,168 plus 758 admits (3,926) out of 4,228 plus 923 completed applications (5,151) is about 76%.
What it is not: it is not a rate for one program, and it is not limited to Grade 12 students. UBC’s pyramid counts cover new undergraduate applicants at all year levels, so transfer students are included. UBC also notes that from 2024/25 the Vancouver counts include post-baccalaureate programs and some diplomas and certificates. Competitive programs admit a much smaller share than the campus figure suggests.
Applications, admits, and registrants for 2025/26
These are the underlying counts behind the admit rate above: new-to-UBC undergraduate applicants for their first-choice program, for the 2025/26 cycle.
| Campus / citizenship | Submitted | Completed | Admitted | Registered (choice 1 / choice 2) |
|---|---|---|---|---|
| Vancouver, domestic | 31,378 | 28,478 | 15,677 | 9,256 / 1,063 |
| Vancouver, international | 14,683 | 13,267 | 9,455 | 2,842 / 471 |
| Okanagan, domestic | 4,808 | 4,228 | 3,168 | 1,836 / 920 |
| Okanagan, international | 1,099 | 923 | 758 | 190 / 187 |
“Submitted” is every application UBC received. “Completed” is the subset UBC finished evaluating and the denominator for its admit rate. “Registered (choice 2)” counts students admitted to a different program than their first choice who registered anyway. Source: UBC Annual Enrolment Report 2025/26 (PAIR).
What actually determines UBC admission
UBC does not publish one university-wide admission average or guaranteed cut-off. UBC states that admission is competitive and comparative: every application is evaluated against the other applications received that year for the same degree, using required courses, grades, and, for most secondary-school applicants, a personal profile. The published floor for Vancouver secondary-school applicants is a 70% overall average, but UBC is explicit that a higher result is often needed in practice because of demand.
| Program | What UBC publishes |
|---|---|
| All Vancouver undergraduate programs | UBC publishes a 70% minimum overall average as a floor for consideration, not a competitive or guaranteed figure. |
| Applied Science (Engineering) | No numeric competitive average is published. UBC's calendar says applicants are selected on standing in required Grade 12 math, chemistry, physics, and English courses, and that "standing above the minimum prescribed requirements is necessary." |
| Sauder School of Business (Commerce) | No admission-average figure is published on the UBC-wide program page reachable for this guide; Sauder's own program-admission pages returned an access error when checked. |
| School of Architecture and Landscape Architecture (SALA) | SALA's official admissions guide does not publish an admission average, applicant count, admitted count, class size, or acceptance rate for any SALA program. |
| Arts and Science | No numeric competitive average is published; UBC's calendar describes qualitative review factors (course breadth, rigor, personal profile) instead of a cut-off. |
For current Fall 2027 deadlines, degree-specific requirements, and the personal profile, see our UBC admission requirements guide.
Is there a “University of Vancouver”?
No. The research university in Vancouver, British Columbia is the University of British Columbia (UBC). UBC’s own pages refer to the school as “UBC” or “UBC Vancouver,” never “University of Vancouver.” The admit-rate and application data above is the official UBC data for that campus.
Official UBC sources
Every figure on this page links back to the official UBC page or report it came from.
- UBC Annual Enrolment Report 2025/26
UBC's own "Admit Rate" and "Yield Rate" tables, and new-to-UBC applicant, admit, and registrant counts, by campus and citizenship, 2021/22 to 2025/26. Read October 8, 2026.
- How UBC evaluates applications
UBC's statement that admission is competitive and comparative, evaluated against other applicants to the same degree in the same year, not against a fixed rate.
- UBC Vancouver admission requirements (secondary-school applicants)
The published 70% minimum overall average and the statement that a higher average is often required because of demand.
- Bachelor of Applied Science admission (UBC Academic Calendar)
Engineering's course-standing selection criteria, with no published numeric competitive average.
- SALA admissions guide
Confirms SALA does not publish an admission average or acceptance-rate figure for architecture or landscape architecture programs.
- UBC Vancouver campus
UBC's own naming: "UBC," "UBC Vancouver," or the University of British Columbia's Vancouver campus, not "University of Vancouver."
Frequently asked questions
Direct answers about UBC's official admit rate, yield rate, application counts, and what UBC does and does not publish about admission averages.
Planning a UBC application?
A peer adviser who has been through UBC admissions can help you plan course selection and your personal profile. UBC is the only official source for admission decisions.