Explore guide
Related resources
Browse all resourcesOn this page
Waterloo Acceptance Rate: What Official Data Shows
Waterloo's FAQ puts admission averages from the high 70s to the mid-90s, and 33.0% of its Fall 2024 Ontario high school entrants had 95% or higher. Waterloo’s admissions FAQ, checked October 8, 2026, puts admission averages between the high 70s and the mid-90s, and 33.0% of its Fall 2024 entrants from Ontario high schools had 95% or higher. Those grade figures are the best official measure. Waterloo’s FAQ asks, “What is Waterloo’s acceptance rate?” and answers without a percentage. Instead, Waterloo publishes an admission range for each program. Computer Science and Software Engineering use individual selection, which has no absolute cut-off. Here is exactly what is and isn’t public.
The short answer
- Waterloo's admissions FAQ, checked October 8, 2026, says admission averages run from the high 70s to the mid-90s.
- In Fall 2024, 33.0% of new full-time students from Ontario high schools entered with 95% or higher.
- Waterloo publishes no applicant or offer counts, so no Waterloo-wide acceptance rate can be worked out.
- Its FAQ answers "What is Waterloo's acceptance rate?" by saying the rate varies by program and year.
- Program pages list ranges instead, such as Computer Science: individual selection from the low to mid-90s.
Reviewed October 8, 2026 · Every range below is reproduced verbatim from the official Waterloo program page it appears on
Save this to your free account
Keep these dates where you'll see them. Free account; we email you before each saved date; unsubscribe any time. Your account’s email pause still applies. The calendar file needs no account.
- Waterloo Engineering (except Architecture)January 15, 2027
- Waterloo, most programs other than EngineeringFebruary 1, 2027
Free account. No card needed.
How we got these numbers
We did not calculate any percentage on this page. Each figure is copied from a Waterloo page, re-read on October 8, 2026.
- High 70s to mid-90s: Waterloo’s own words in its admissions FAQ. It describes the grades of students admitted in the previous year.
- 33.0% with 95% or higher: from Waterloo’s Performance Indicators, Fall 2024, the newest year it shows. It counts new full-time first-year students from Ontario high schools who entered with 95% or higher, as a share of all such students who registered.
What these figures are not: neither one is an acceptance rate. An acceptance rate needs the number of offers and the number of applicants. Waterloo publishes neither count, so no honest Waterloo-wide percentage of admitted applicants can be worked out. Any site that prints one did not get it from Waterloo.
Waterloo’s own answer
Most universities simply never raise the subject. Waterloo does. Its commonly asked admission questions page, fetched live on October 8, 2026, lists “What is Waterloo’s acceptance rate?” among its questions and answers it in two sentences:
“Waterloo’s acceptance rate varies by program and can vary by year. If you meet the admission requirements, you should apply.”
No percentage follows. On the same page, Waterloo gives a university-wide average range instead:
“Waterloo’s admission averages range from high 70s to mid-90s. Admission averages can vary depending on the number of applications we receive, the number of spaces available in each program, and the grades of students who apply.”
That statement describes grades, not the share of applicants who receive offers. It is the closest Waterloo comes to one university-wide admissions headline.
What official data exists, and what doesn’t
Waterloo has a large public institutional-research operation, so we checked it carefully. Institutional Analysis & Planning publishes student headcounts, full-time equivalents, and degrees from registration-system count dates. Its report index also covers government and institutional indicators. The discontinued Student Statistics Handbook ends at 1996-97. None of these sources provides application, offer, or admitted-student counts. Some additional IAP data requires a Waterloo login.
Waterloo participates in Common University Data Ontario (CUDO), and IAP links to it. Waterloo’s public entering-average indicator covers first-year undergraduates who applied and then registered in the fall. It measures registrants, not all applicants or offers. A registrant-only measure cannot produce an acceptance rate.
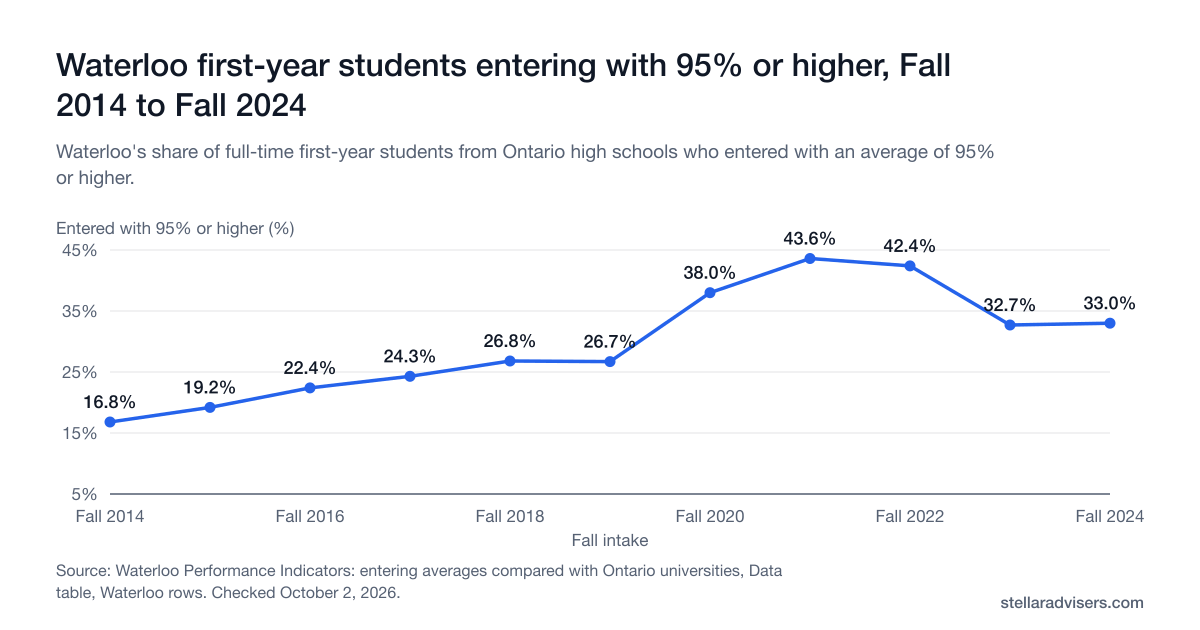
It does show how strong the entering class is. In Fall 2024, 33.0% of Waterloo’s new full-time students from Ontario high schools entered with an average of 95% or higher, and 32.4% with 90% to 94%. The 95%-plus share rose from 16.8% in Fall 2014 to a high of 43.6% in Fall 2021.
Source: Waterloo Performance Indicators: entering averages compared with Ontario universities, Data table, Waterloo rows. Reviewed October 2, 2026. The axis runs from 5% to 45% so the labels stay readable. These describe students who enrolled, not admission cut-offs. Waterloo draws the figures from Common University Data Ontario, which covers students who applied from an Ontario high school.
Show the numbers
| Fall intake | Entered with 95% or higher (%) |
|---|---|
| Fall 2014 | 16.8% |
| Fall 2015 | 19.2% |
| Fall 2016 | 22.4% |
| Fall 2017 | 24.3% |
| Fall 2018 | 26.8% |
| Fall 2019 | 26.7% |
| Fall 2020 | 38.0% |
| Fall 2021 | 43.6% |
| Fall 2022 | 42.4% |
| Fall 2023 | 32.7% |
| Fall 2024 | 33.0% |
| Fall intake | Entered with 95% or higher | Entered with 90% to 94% |
|---|---|---|
| Fall 2024 | 33.0% | 32.4% |
| Fall 2023 | 32.7% | 32.0% |
| Fall 2022 | 42.4% | 29.6% |
| Fall 2021 | 43.6% | 32.1% |
| Fall 2020 | 38.0% | 31.6% |
| Fall 2019 | 26.7% | 33.1% |
| Fall 2018 | 26.8% | 32.8% |
| Fall 2017 | 24.3% | 35.7% |
| Fall 2016 | 22.4% | 35.8% |
| Fall 2015 | 19.2% | 36.6% |
| Fall 2014 | 16.8% | 34.8% |
Source: Waterloo Performance Indicators, entering averages compared with Ontario universities, Waterloo rows. These are averages of students who enrolled, not admission cut-offs.
We also checked the Council of Ontario Universities’ CUDO portal on October 8, 2026. Its admission table (B1) reports applicants, applications and registrants by program. It has no count of offers, so it can’t produce an acceptance rate either. Every range here comes from a Waterloo page fetched successfully on that date.
What Waterloo publishes instead: admission ranges
Waterloo program pages publish admission ranges for Ontario high school applicants. A range describes where most admitted students’ averages fell in the previous year. It is not a threshold or an acceptance rate. The ranges below reproduce the official program wording as it stood on October 8, 2026.
| Program | Published admission range | How the page labels selection |
|---|---|---|
| Computer Science | Individual selection from the low to mid-90s | Individual selection |
| Software Engineering | Individual selection from the low to mid-90s | Individual selection |
| Computer Engineering | Individual selection from the high 80s to low 90s | Individual selection |
| Civil Engineering | Individual selection from the mid- to high 80s | Individual selection |
| Architecture | Individual selection from the mid-80s | Individual selection plus portfolio |
| Mathematics | Individual selection from the mid-80s | Individual selection |
| Accounting and Financial Management | Mid-80s | Published admission average |
| Kinesiology | Low 80s (regular) and mid-80s (co-op) | Published admission average |
| Biology | Low 80s | Published admission average |
| Honours Arts | High 70s | Published admission average |
Source: the official University of Waterloo program pages. “Individual selection” appears on the Waterloo page itself; other programs publish a plain admission average. Ranges vary with available spaces, applicant volume, and qualifications. For deadlines, required documents, tuition, and scholarships, see the complete University of Waterloo admissions guide.
Computer Science and Software Engineering
“Waterloo CS acceptance rate” has no official numeric answer. Waterloo publishes no Computer Science applicant or offer count. Its program page instead lists individual selection from the low to mid-90s as of October 8, 2026. Software Engineering lists the same range.
The phrase before the range is important. Individual selection uses grades with supplementary forms or interviews, and Waterloo says it has no absolute cut-off. Engineering except Architecture, Mathematics, and the School of Architecture use the process. The low-to-mid-90s range describes prior admitted students; it is not a guaranteed threshold. Computer Science also requires the Admission Information Form. Software Engineering requires a written interview.
The two programs share a published range but are genuinely different applications: different faculties, different prerequisites, different deadlines, and co-op-only status for Software Engineering. If you are weighing one against the other, our Waterloo Computer Science vs Software Engineering comparison sets the current official requirements side by side.
What actually determines Waterloo admission
Waterloo calculates an admission average from six Grade 12 U or M courses, including every required course. That average is a starting point, not the entire decision. Individual-selection programs also review the Admission Information Form and, when required, an interview or portfolio.
Waterloo Engineering says decisions are never based on grades alone and that it has no cut-off. It applies an adjustment factor based on a school’s historical performance over more than six years. Waterloo calls that factor a small part of the overall decision. Academic performance, the Admission Information Form, and the online interview carry more weight. Individual school values are not published, so applicants cannot calculate their own adjustment.
Official sources
Every figure and quotation on this page links back to the University of Waterloo page it came from.
- Commonly asked admission questions
Waterloo's FAQ has an entry titled "What is Waterloo's acceptance rate?" It answers without a number. The same page says admission averages range from the high 70s to the mid-90s. Re-checked live October 8, 2026.
- What does individual selection mean?
Waterloo says individual-selection programs use grades with supplementary forms or interviews. It also says these programs have no absolute cut-off grades. The page lists Engineering except Architecture, Mathematics, and the School of Architecture as users of this process.
- Understanding admission requirements
Waterloo says a range describes where most admitted students' averages fell in the previous year. Ranges depend on available spaces, applicant volume, and applicant qualifications. They therefore vary by program and year.
- What is an admission average?
Waterloo calculates an admission average from the top six Grade 12 U or M courses, including every required course. The page makes no acceptance-rate or admission-rate statement.
- Waterloo Engineering admissions FAQs
Waterloo Engineering says a decision is never based on grades alone and that it has no cut-off. The page also describes an adjustment factor based on a school's historical performance over six or more years.
- Computer Science degree
The current Ontario Computer Science range is individual selection from the low to mid-90s. The page also lists the required Grade 12 courses. Re-checked live October 8, 2026.
- Software Engineering degree
The current Software Engineering range is individual selection from the low to mid-90s. The page also publishes 70% course minimums and a programming-experience requirement. Re-checked live October 8, 2026.
- Institutional Analysis & Planning: university data and statistics
Waterloo's institutional-research office publishes CUDO links, faculty data, enrolment, and degrees. It does not publish application, offer, or admitted-student counts there. Further data requires a Waterloo login.
- Institutional Analysis & Planning: student data
Waterloo's student datasets cover headcounts, full-time equivalents, and degrees granted. They come from registration-system count dates. These are enrolment measures, not an admissions funnel.
- Performance Indicators: entering averages compared with Ontario universities
Waterloo's CUDO-sourced indicator covers first-year undergraduates who applied and then registered in the fall. It measures registrants, not applicants or offers, so it cannot produce an acceptance rate. The most recent year shown is still Fall 2024; the chart and table on this page copy its Waterloo rows from Fall 2014 to Fall 2024, re-read October 8, 2026.
- Common University Data Ontario (CUDO) at Waterloo
Waterloo's CUDO page hosts no tables and directs readers to the Council of Ontario Universities.
- Council of Ontario Universities: Common University Data Ontario (CUDO)
CUDO's admission table (B1, Applicants and Registrants by Program) reports applicants, applications and registrants. It has no offers field, so it cannot produce an acceptance rate. The portal was reachable on October 8, 2026.
Frequently asked questions
Direct answers about Waterloo's own acceptance-rate statement, why no application or offer counts are public, and what the Computer Science and Engineering ranges actually mean.
Planning a Waterloo application?
A peer adviser who has been through Waterloo admissions can help you build a program list around the ranges Waterloo actually publishes. Waterloo is the only official source for admission decisions.